We are going to start off today (month, year) with two rather complicated topics. Apologies in advance.
In the autumn of 2001 two things happened within the markets. The combination of long-term U.S. Treasury prices and the U.S. Dollar Index peaked and the CRB Index bottomed and started to rise. For the next ten years the markets were, by and large, driven by the commodity price trend.
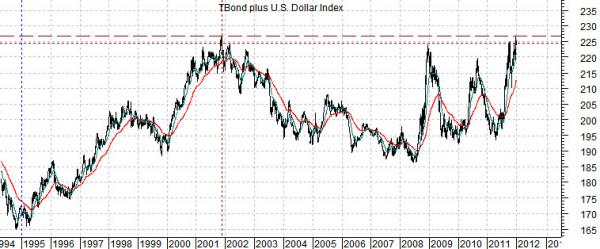
Below is a chart of the sum of the price of the U.S. 30-year T-Bond futures and the U.S. Dollar Index (DXY).
The ‘four quadrants’ argument suggests that a trend involving a weak dollar and weak bond market will favor the basic materials and energy sectors. On the other hand a trend involving a stronger dollar and rising bond market will benefit large cap U.S. defensive stocks (i.e. utilities, consumer staples, health care, etc.) Falling bond prices favor cyclical growth while rising bond prices go with cyclical weakness. A falling dollar supports rising commodity prices while a rising dollar puts pressure on raw materials prices.
The chart argues that the sum of the TBond and dollar peaked in 2001. In 2008 and 2010 the sum pushed up towards the highs as the equity markets declined due to weakness in the economically sensitive sectors. Fair enough.
The question at present is… what happens next?
The sum ended 2011 at the peak for the range as the defensive sectors outperformed the cyclicals. From here one of two things has to eventually happen. The sum can swing lower or it can push to new highs.
If the bond market and dollar turn lower then the argument would be that we return to the same old trend. A trend that favors Asian growth, commodity prices, commodity currencies, basic materials, energy, etc.
If the bond market and dollar continue to rise then the focus will remain on U.S. large cap defensive names. Recent experience has shown that this goes with weakness in the equity markets but if we expand the time horizon somewhat we can see that this has not always been the case.
The point is that in 1995 the bond market and dollar began to rise. This led into a very strong equity markets trend that culminated five or six years later in the Nasdaq’s bubble peak. The thought is that one way to alter the trend away from its recent commodity-centric state would be through a push to new highs for the bond market and dollar. If, as, or when that happens we will have to take a close look at how it is impacting the broad market as well as the various cyclical and defensive sectors.
The argument is that the cyclical trend lags changes in the direction of yields by two years.
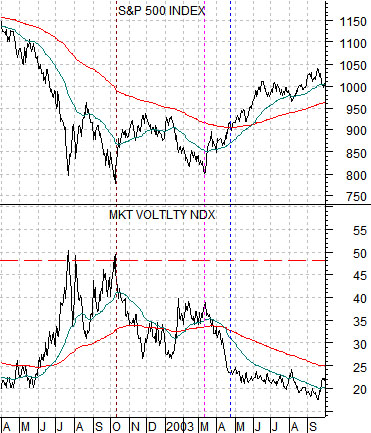
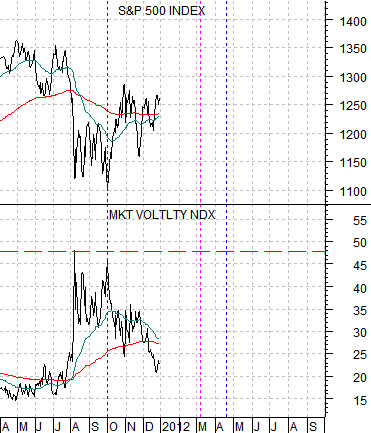
Below is a chart of the S&P 500 Index and CBOE Volatility Index (VIX) from 2002- 03. The same comparison for the current time frame is shown below.
The VIX made its final top in October of 2002. The SPX bottomed at that time although it circled back towards the lows into the spring of 2003.
We could show that U.S. short-term yields began to decline in the autumn of 2000 and then argue that the 2-year lag supported the start of a recovery in the autumn of 2002. The problem is that there is no way that we can use the same comparison for the current time frame given that short-term yields have been pancaked at the lows for the last 3 years.
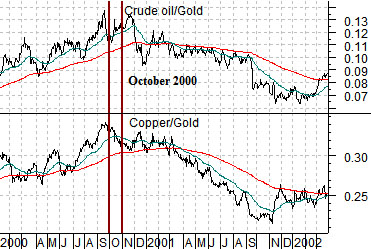
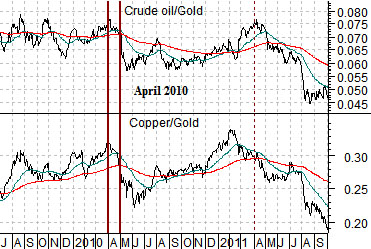
One way to deal with this is to use relationships that ‘go with’ yields. Below are charts of the crude oil/gold ratio and copper/gold ratio from 2000- 02 and 2009- 11.
Downward pressure on yields began in the autumn of 2000. The VIX peaked with the SPX bottoming two years later in 2002. Downward pressure on yields occurred in the spring of 2010 and then again around the first quarter of 2011. The argument would then be that based on the 2-year lag we could continue to see a somewhat negative cyclical growth trend through the first quarter of this year with the prospect of another period of pressure into the spring of 2013.