In a recent issue we argued that the markets are ‘in between’. In between the start of the recovery that coincided with the low point for the last recession (peak for weekly U.S. jobless claims in March of 2009) and the point in time when growth has expanded far enough and long enough to create sufficient cyclical traction to start a rising trend for the laggard sectors. No matter what else we do along the way… this is the template that we are using with respect to the markets. In between.
The problem is that at present we have no way of knowing how long it will be until traction shows up. So… we have to keep busy focusing on a variety of other perspectives to help pass the time.
Taking a most circuitous route we are going to attempt to explain why we are bullish on the energy ‘user’ sector.
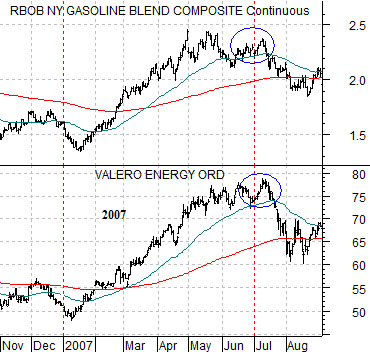
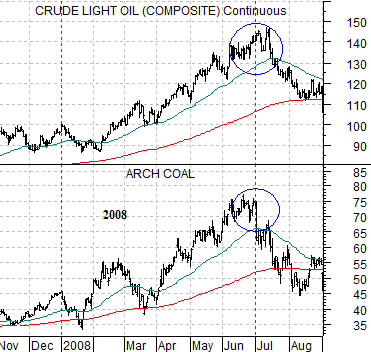
Below is a chart of gasoline futures and the share price of Valero from 2007. Below right is a comparison between crude oil futures and Arch Coal from 2008.
Our argument has almost nothing to do with these chart comparisons aside from the fact that they help to show something that the markets were doing a few years back. We argued quite frequently that in the years leading up to 2008 the calendar was essentially split into two six-month time frames with a ‘strong energy and base metals’ trend dominating the markets from January through June and ‘something else’ kicking into gear from July through December.
The term ‘something else’ is obviously quite vague but that is actually the best way to describe it. The charts at right show that in 2007 the first half of the year featured a very strong price trend for gasoline futures along with a bullish response from oil refiner Valero. By the start of the third quarter in July the trend simply… reversed.
The first six months of 2008 included not only a powerful rising trend for crude oil prices but also sympathetic strength for almost everything related to energy including nuclear, gas, oil, and even coal. The share price of Arch Coal doubled through the first half of 2008. When the energy trend finally turned negative in July virtually everything related to growth and risk collapsed.
The argument is that prior to 2008 the markets were pushing energy and base metals prices higher over the first half of the year and then rotating over to ‘other sectors’ for the final six months. ‘Other sectors’ included everything from the consumer stocks to the airlines and even bonds and gold.
The next point is that the broad stock market reacted to the mid-year trend change in a variety of ways.
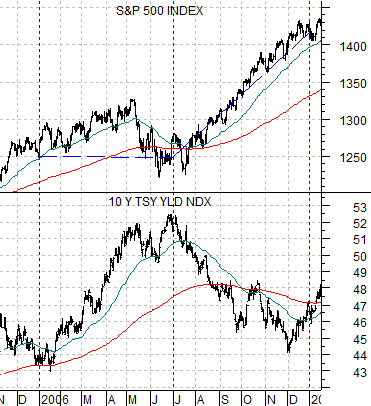
Below is a chart from 2006 showing the S&P 500 Index and 10-year U.S. Treasury yields.
In general the equity markets have trended with cyclical growth. In general the equity markets have trended with energy and base metals prices. In specific, however, this has not always been the case and this is the detail that makes our work quite challenging.
We have included the chart below to make two points. First, yields tend to trend with cyclical growth. This explains why 10-year yields moved higher over the first half of 2006 and then lower over the balance of the year. Second, the way the S&P 500 Index reacts to changes in interest rates varies. We can not write that the SPX will decline if yields decline- although that is often the case- because we can show an example like 2006 when the SPX drove to the upside as yields moved lower.
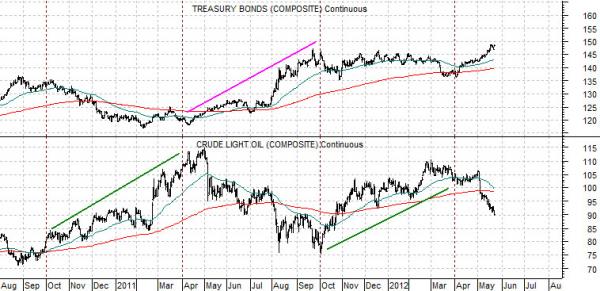
The next chart below compares U.S. 30-year T-Bond futures and crude oil futures from 2010 to the present day.
Our above point was that in recent years the cyclical trend was positive from January through June and then negative from July through December. The next point was that the trend for the broad large cap stock market will vary from year to year. In 2008 the stock market collapsed on oil price weakness while in 2006 the trend was relentlessly higher.
The next argument is that we are still seeing six month bouts of cyclical strength and weakness but… the time frames have shifted. Instead of January through June we appear to be working off of an October through March cycle.
Notice on the chart below that oil prices were stronger from October to March in both 2010- 11 and 2011- 12. As crude oil prices rose the trend for bond prices was lower. The argument is that if nothing in particular changes… we could see downward pressure on energy prices into the autumn along with upward pressure on bond prices.