It is going to be a new-heavy week. The Fed’s meeting concludes on Wednesday at which time the details surrounding the next round of quantitative easing will be announced. The Bank of Japan has moved up its mid-November monetary policy meeting to Thursday and Friday of this week in order to react accordingly to new upward pressure on the yen. As well we will see the latest U.S. employment data on Friday.
Goldman Sachs noted last week that a modified Taylor Rule would argue that the appropriate level for the funds rate at present would be somewhere between -5% and -7%. With the funds rate blocked vertically the alternative now is to expand monetary policy horizontally through the aggressive repurchase of Treasuries. The Taylor Rule, by the way, is based on actual inflation compared to target inflation and actual GDP compared to potential GDP.
There are always reasons to find the glass half empty; the markets, after all, do best when faced with a wall of worry. The prospect of aggressive monetary stimulus is such a positive that one always worries about the ability of the markets to buy the rumor and sell the news. Still… we thought it might make sense today to start off with a bullish perspective.
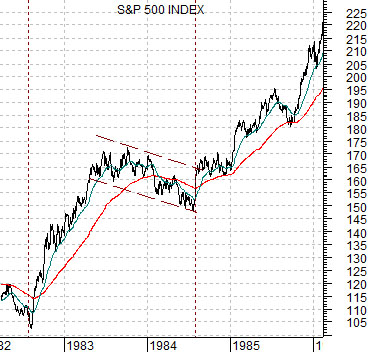
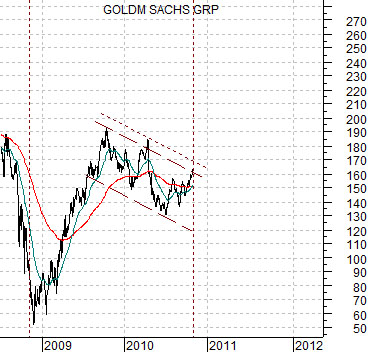
Below is a chart of the S&P 500 Index from 1982 into early 1986. Below right we have included a chart of the share price of Goldman Sachs (GS) from 2008 up to the present day.
Some time ago we started to run chart comparisons arguing that the equity market’s momentum was starting to wane. We showed charts similar to the ones at right to make the point that after the initial upward blast there is typically a period of consolidation. Following the bottom in August of 1982 the SPX pushed higher through 1983 before trailing lower into August of 1984. In other words… the pivot bottom in 1984 was made around 2 years after the start of the bull trend.
Using GS as our markets surrogate we show that the share price bottomed in November of 2008 only to peak out late in 2009. After a period of price correction the share price began to recover somewhat through the second half of this year. If history were to repeat exactly… the corrective and downward sloping channel for GS would be broken to the upside this month leading into a steady rise up the 200-day e.m.a. line well into 2012. In other words… if the markets find reason to respond positively to QE2 the recovery could extend both in terms of time and price.
Equity/Bond Markets
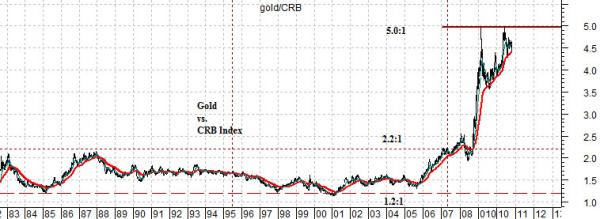
We are going to start with the chart at the bottom of the page. This chart shows the ratio between gold futures and the CRB Index.
From 1982 into 2007- a period of roughly 25 years- the ratio between gold and general commodity prices (CRB Index) remained fairly stable between 2.2:1 and 1.2:1. In other words with the CRB Index close to 300 today the expected price range for gold would be somewhere between 360 and 660.
Now… one could argue that central bank sales, market manipulation, and the gold carry trade combined to hold gold prices artificially ‘low’ for many years but in terms of our chart the game changed back in 2007 as the ratio busted through the top end of the range only to continue until it reached a high of 5:1 in early 2009.
We have argued that the two tests of the 5:1 level for this ratio have gone roughly with stock market bottoms. A case can be made for a bullish equity markets trend as long as the ratio remains below 5:1.
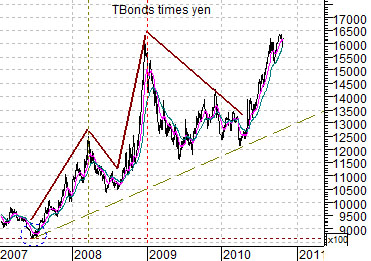
The chart further below shows the product or combination of the U.S. 30-year T-Bond futures times the Japanese yen futures.
There have been two major carry trades within the markets over the past decade or so- the gold carry trade (borrowing central bank gold at low lease rates, selling it into the market, and investing the proceeds in higher yielding securities) and the yen carry trade (borrowing yen at close to 0%, selling yen, and buying higher yielding securities abroad). Our point is that the rising trend for gold is also the same trend that is pushing bond prices and the yen upwards. For gold prices to turn negative we will also need to see weakness in the TBonds and the yen and this has not happened as of yet.
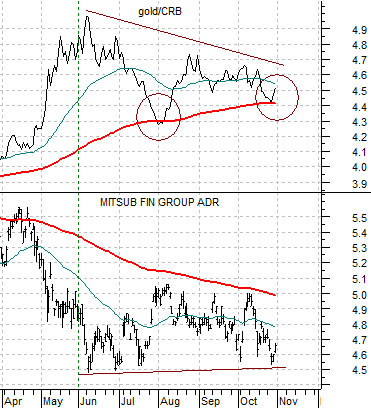
And lastly we show the gold/CRB Index ratio and the share price of Japanese bank Mitsubishi UFJ (MTU).
The ongoing argument has been that the negative trend for MTU is a reflection of the positive trend for the gold/CRB Index ratio. To turn the ratio lower the corrections have to stop finding support at the 200-day e.m.a. line. Notice that this is exactly what happened last week as gold prices firmed relative to the CRB Index.