We tend to focus primarily on potential trend changes but since trends seem to last far longer than one thinks possible it makes sense to spend a bit of time showing what the current trend actually is.
In past issues we have argued that the S&P 500 Index should do fairly well with a flat bond market, rally sharply with a weak bond market, and shift into a state of risk if bond prices ramp up to new highs. On the other hand the argument has been that falling long-term yields have been raising the floor (i.e. support) under the defensive and non-cyclical issues so the issue isn’t THAT yields are declining but rather WHY.
The point, we suppose, is that falling yields are always a positive for equities; it is the reason yields are declining that is the negative. If yields are moving lower due to issues ‘elsewhere’ then it is possible for stocks to resolve higher even with continued bond price strength.
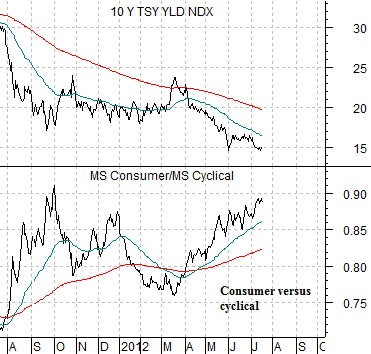
In any event… at top right is a chart of 10-year Treasury yields and the ratio between the Morgan Stanley Consumer Index divided by the Cyclical Index.
Since March the trend has included falling long-term yields and relative strength from the consumer and defensive issues. Weakness in cyclical has been offset by strength in the consumer large caps.
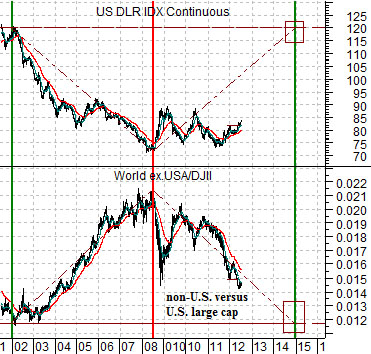
Below is a comparison between the U.S. Dollar Index (DXY) futures and the ratio between the World ex-USA Index and the Dow Jones Industrial Index. The World ex.USA/DJII ratio measures the relative strength between ‘everything else’ and ‘U.S. large caps’.
The argument here is that a weak dollar favors ‘everything else’. A weak dollar represents money moving away from the U.S. in search of higher returns in all the various nooks and crannies of the globe.
A stronger dollar creates the opposite trend. The U.S. large caps underperformed ‘everything else’ from the end of 2001 into 2008 on dollar weakness and have been steady outperformers on dollar strength over the past four years.
The bottom line is that a rising bond market promotes strength in the defensive stocks while a stronger dollar leads to outperformance by the U.S. large cap names.
Equity/Bond Markets
Intel reported earnings earlier this week and lowered its revenue forecast. The stock… rose in trading yesterday in response.
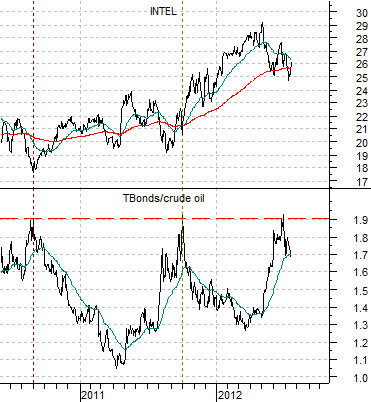
First below is a chart of Intel (INTC) and the ratio between the price of the U.S. 30-year T-Bond futures and crude oil.
The TBond/crude oil ratio recently rose to the same peak that marked the highs in 2010 and 2011. As it declined the price of Intel moved higher. From this perspective as long as the price of the TBonds is not rising rapidly against oil prices the expected path for INTC would be higher.
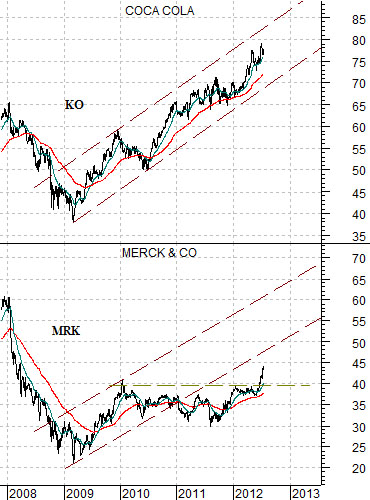
Next is a view of Merck (MRK) and Coca Cola (KO).
We showed this comparison on a few occasions in recent weeks because chart-wise it appeared that the drug stocks were getting ready to move higher. The trend for MRK should be similar to that of KO but the stock had been stuck below the 40 level.
Over the past week or so MRK seems to have gathered enough steam to push through resistance and, in due course, may move back into the rising trading channel created back in 2009.
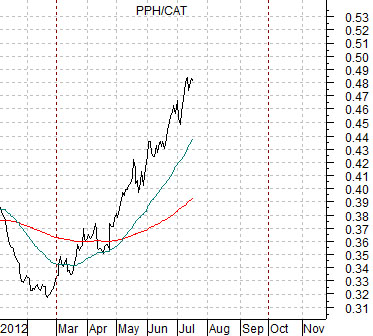
Last is a chart of the pharma etf (PPH) divided by the share price of Caterpillar (CAT).
Over the past couple of years the trend has been neatly divided between ‘cyclical strength’ from October through March and ‘cyclical weakness’ from April through September.
If the pattern repeats then the ratio between the pharma stocks and cyclicals tied to construction (i.e. CAT) should continue to show strength through the balance of this quarter.
