The markets continue to face conflicting cross currents as negative pressure from European credit downgrades butts into the potential for positive pressure from quarterly earnings reports. Once again the markets appear to be some sort of cross roads.
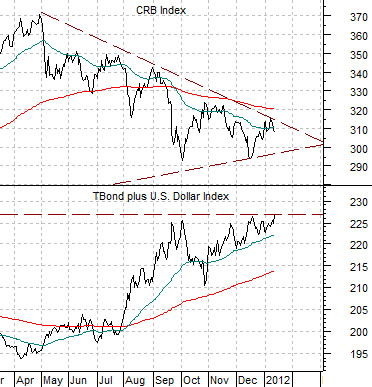
First is our chart of the CRB Index and the sum of the price of the U.S. 30-year T-Bond futures and U.S. Dollar Index (DXY).
The argument once again is that the sum of the TBond and dollar peaked in 2001 as well as the end of 2008 around the 227 level. This is exactly where the sum has been struggling since the September of last year.
If the sum resolves to the down side then commodity prices should rise as the cyclical trend strengthens. If, on the other hand, the dollar and bond market continue to push higher then a case can be made that the entire commodity price-driven trend that began back in 2001 has come to an end.
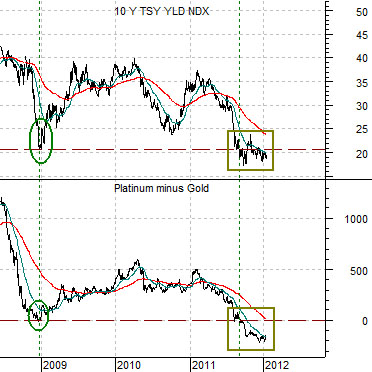
Next is a chart of 10-year Treasury yields and the spread between platinum and gold futures prices.
There isn’t anything particularly important about the spread between platinum and gold aside from our observation that it bottomed at the end of 2008 at ‘0’ and marked the low point for yields and Asian growth. The spread also tends to trend with copper prices.
The point is that the spread declined to ‘0’ last year as 10-year yields fell back to around 2.1%. Our view is that as long as platinum is weaker than gold there will be downward pressure on yields. As the spread moved below ‘0’ yields broke down below 2.0%.
If there is downward pressure on yields then there will, by extension, be upward pressure on bond prices. If 10-year yields, ocean shipping rates, and the spread between platinum and gold can decline to or below the lows from the end of 2008 then it is not inconceivable that the CRB Index will follow a similar path which would take it back to somewhere closer to 200. The argument is that if the sum of the TBond and dollar continues to rise then we could see ‘surprising’ weakness in the commodities markets.
Equity/Bond Markets
During periods of strength in the price of the TBond and dollar (chart above) we tend to get a rising ratio between equities and commodities. In other words… the ratio between the S&P 500 Index and CRB Index will tend to push upwards.
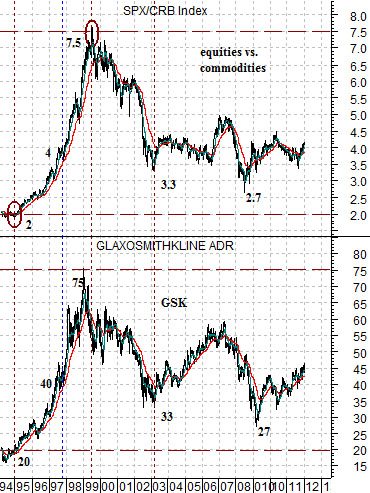
Below is a comparison between the SPX/CRB Index ratio and the share price of GlaxoSmithKline (GSK).
Going back 15 to 20 years the general level of the share price of GSK has been similar to the equity/commodity ratio. GSK was 20 back in 1995 as the ratio rose up through 2.0. GSK peaked at 75 while the ratio topped around 7.5. And so on.
The point is that downward pressure on yields and commodity prices should create upward pressure on the SPX/CRB Index which will, in turn, lead to some kind of upward pressure on the health care and pharma stocks.
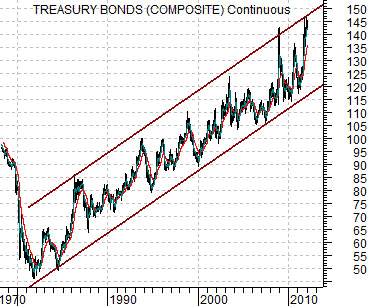
Next is a chart of the U.S. 30-year T-Bond futures from 1978 to the present day. This is the premise for an argument that will take us right through the third page today.
The TBonds have been trending higher for close to 30 years. All things being equal the TBonds are very close to the top of the trading range. The trend for bond prices has been steadily higher while other asset classes have tended to ‘take turns’ along the way.
The concept of ‘taking turns’ is quite important. All asset prices do not rise at the same time. What we tend to get are periods of time when certain sectors are stronger followed by a rotation into other themes. Eventually the markets get around to almost everything.
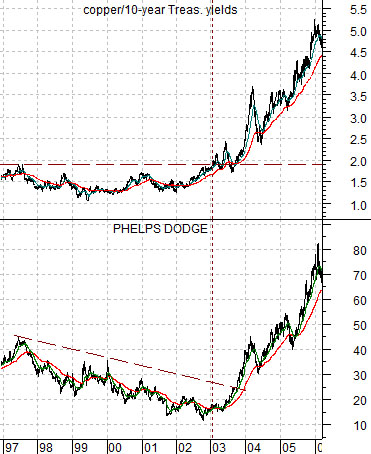
Last is a chart of Phelps Dodge (which was bought by FreePort McMoRan a number of years ago) and the ratio between copper and 10-year Treasury yields.
The argument was that the commodity cyclicals were set to ‘take a turn’ back in 2002. The intermarket justification came from the combination of rising copper prices and declining yields so as base metals prices moved upwards relative to interest rates the markets rotated into a decade-long love affair with the basic materials stocks.