The basic story with regard to crude oil has been that with emerging and Asian (China) markets demand rising strongly as soon as demand in the developed markets (U.S.) returned to pre-2008 levels we would see dramatically higher prices. On the other hand it has been our experience that when everyone is trading off of the same basic thesis… something unexpected will tend to occur.
Nov. 17 (Bloomberg) — Crude oil declined for a fourth day on speculation that China will raise interest rates, slowing economic growth in the world’s biggest energy-consuming country.
The point is that instead of developed markets demand recovering to drive energy prices higher recent credit tightening in China raises the spectre of emerging markets demand declining. The end result is downward pressure on energy prices.
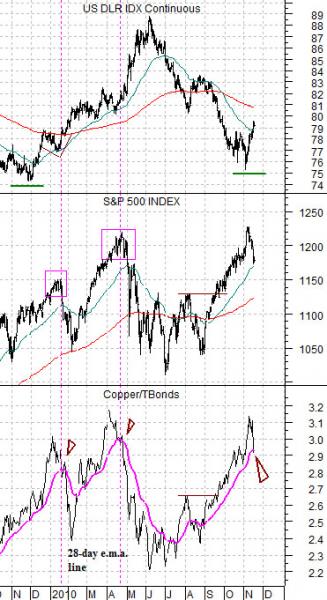
In any event we thought that we would show a number of the charts that we have been using to track the trend for the S&P 500 Index today. To start off with we have included a comparison between the U.S. Dollar Index (DXY) futures, the S&P 500 Index (SPX), and the ratio between copper futures and the U.S. 30-year T-Bond futures.
The initial argument is that the trend for the SPX is almost identical to the trend for the copper/TBond ratio. The second point is that the SPX tends to turn lower once the copper/TBond ratio falls through its 28-day e.m.a. line. The third detail of note has to do with the U.S. dollar.
Notice that the dollar turned higher in November of 2009 while the first correction of significance for the SPX did not take place until roughly six weeks later in mid-January of 2010. The idea is that dollar strength has the potential to turn the stock market lower… give or take a month or two.
Our sense is that the equity market’s positive trend is hanging by a very small thread at present. We thought it might be possible for the U.S. Dollar Index to rally up to its 200-day e.m.a. line, correct lower, and then punch back through this line (as was the case in January of this year) before we had to face the prospect of a correction back towards the 1130 region (200-day moving average line) for the SPX. In a sense the fate of the trend rests with copper’s ability to hold at current levels while bond prices continue to grind lower.
Equity/Bond Markets
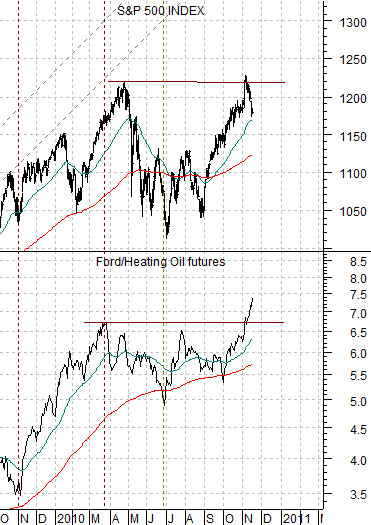
The chart below compares the SPX with the ratio between Ford (F) and heating oil futures.
We have been using this comparison for quite some time. Our argument was that the F/heating oil ratio should ‘define’ the trend for stock market coming out of the 2008- 09 bear market bottom.
The chart shows that the F/heating oil ratio tracks with the SPX and has shown the tendency to ‘lead’ somewhat at the turns. Notice that the ratio peaked a month or so ahead of the broad market last spring and actually bottomed just ahead of the SPX in late June.
The point? The Ford/heating oil ratio is still making new highs so if it is leading the SPX the trend appears to be quite nicely positive.
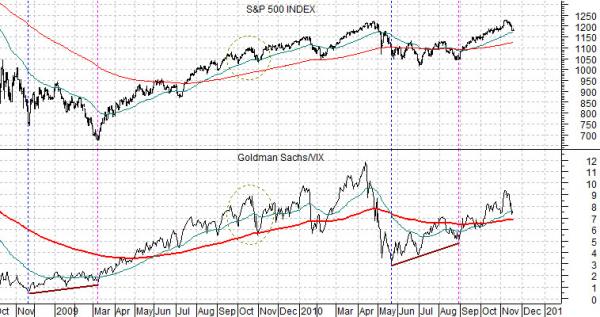
Below is a chart of the ratio between the share price of Goldman Sachs (GS) and the CBOE Volatility Index (VIX). We compare the GS/VIX ratio with the S&P 500 Index.
Why the GS/VIX ratio? Because GS is, more or less, ‘the market’ and the VIX tends to rise each time money begins to flee towards safety. As long as the GS/VIX ratio is rising the basic trend for the equity markets is likely positive.
We argued in late 2008 that the series of ‘higher lows’ for the GS/VIX was an encouraging sign. In March of 2009 the SPX finally turned upwards. We argued the same thing this past summer as the GS/VIX held the May lows while the broad market appeared set to collapse.
Our point with this chart would be that a correction back to but not through the 200-day e.m.a. line for the GS/VIX ratio in October of 2009 pulled the SPX back to its rising 50-day e.m.a. line. That is essentially what has happened to date so from a ‘glass is half full’ perspective a minor correction in the ratio goes with a minor correction for the broad market with higher prices expected in the near future.