Jan. 20 (Bloomberg) — China’s stocks fell the most in a week and interest-rate swaps rose on speculation the nation’s central bank may raise borrowing costs for the first time in more than two years.
Jan. 20 (Bloomberg) — Stocks slid, dragging the Standard & Poor’s 500 Index down from a 15-month high, while commodities tumbled and the dollar and Treasuries gained on concern China’s moves to curb lending will slow the global economic recovery.
The flavor of the day yesterday was credit tightening in China spilling over into the Asian equity markets and from there into the forex markets as the dollar found a bid before pressuring commodity prices lower. From our point of view, however, this still had the look of a correction instead of an actual trend change.
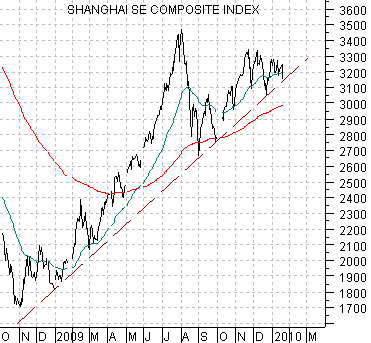
Below we show China’s Shanghai Composite Index. The argument is that as long as the Shanghai Comp. is holding above the rising support line… the trend has not changed. It may do so today but through trading on Wednesday the support line had held.
The next point is… what happens if the support line is broken? Should one jettison all equity positions?
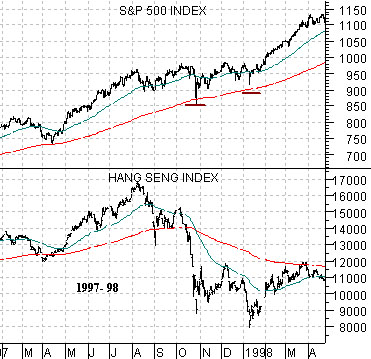
Below we show a comparison between the S&P 500 Index (SPX) and Hong Kong’s Hang Seng Index from 1997- 98.
We have argued in recent issues of the IMRA that ‘an Asian equity market’ often busts to the down side months ahead of final peak for broad asset prices. If the Hang Seng Index and Shanghai Comp. break support then we offer up a two-part answer.
First, as one can see on the chart comparison at right when the Hang Seng fell off a cliff in 1997 there was downward pressure on the SPX until the Hang Seng found some kind of short-term bottom. In the very short run a trend break by the Asian equity markets will carry most if not all equity markets lower.
Second, markets like the Hang Seng often turn lower early so while the ride may prove to be bumpy the 1997 example shows that a break in Asian share prices does not necessarily mean the end of the world for the SPX. In 1997 the SPX held essentially flat until the Hang Seng Index finally reached bottom in January of 1998.
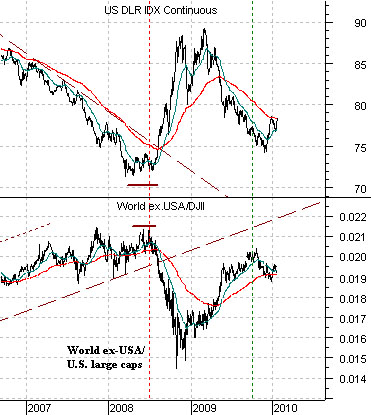
Below is a comparison between the U.S. Dollar Index (DXY) futures and the ratio between the World ex. USA Index and the Dow Jones Industrial Index. The ratio essentially measures the relative strength between the equity markets ‘everywhere else’ and large cap U.S. stocks.
The argument is that when the dollar is trending lower ‘everywhere else’ does better than the Dow 30. Fair enough. The opposite is true when the dollar trends higher.
To expand on our argumentabove, the idea is that IF the Hang Seng Index break support THEN we would expect the dollar to strengthen AND this would go with outperformance by the U.S. large cap names. As we learned in 2008 ‘outperformance’ is a relative term and can easily mean nothing more than ‘going down by a smaller percentage’.
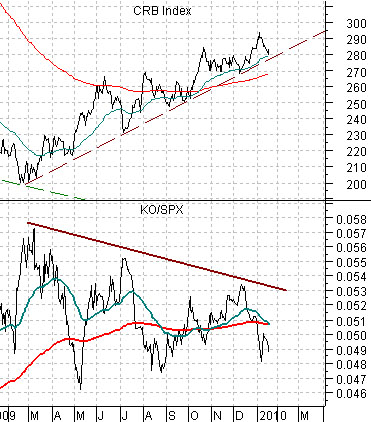
Below we return to the chart that compares the CRB Index (commodity prices) and the ratio between Coca Cola (KO) and the S&P 500 Index (SPX). Why has Coke been trading so heavily of late? Our answer would be that the trend for commodity prices is still positive. If the CRB Index were to break and close nicely below 277 (versus 279.48 yesterday) then we would expect to see the KO/SPX ratio turning upwards.
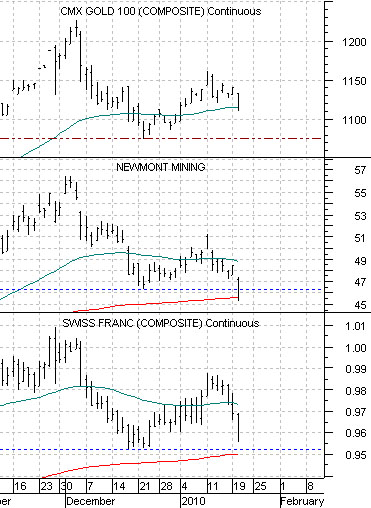
Below is our comparison of gold futures, the share price of gold miner Newmont (NEM), and the Swiss franc futures.
In trading yesterday gold, the franc, and NEM declined. NEM managed to rally just far enough into the close to hold the December lows. The franc has yet to break .9500 which suggests that gold should still find support around the 1080 range.
