We often show rather dramatic comparisons and then, after a time, relegate them to the trash bin once the expected outcome fails to occur. For a change of pace today we thought that we would return to just such an argument.
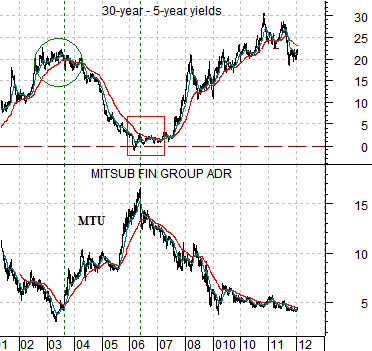
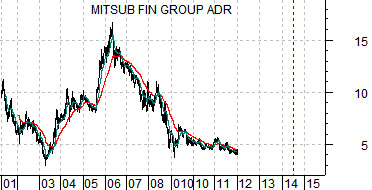
We are going to compare two charts today using two very different perspectives. Both are based on the yield spread or difference between 30-year and 5-year U.S. Treasury yields as well as the share price of Japanese bank Mitsubishi UFJ (MTU).
The comparison at right features the yield spread and MTU in ‘real time’. In other words we are tracking the trend for the yield spread against the share price of MTU to make the argument that relationship is ‘inverse’. When the yield spread reaches a peak the price of MTU should be at a bottom and when the yield spread contracts to around the ‘0’ line (indicating that 30-year and 5-year yields are at similar levels) MTU should be close to a cycle peak.
So… in real time the relationship is fairly consistent. The yield spread rises with the bond market so as long as U.S. and Japanese bond futures prices are rising one would expect to see downward pressure on the laggard banks.
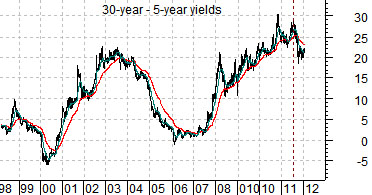
Below we take the same two charts and present them in a different way by ‘lagging’ the price of MTU behind the yield spread by three years.
The argument was that the yield spread bottomed in 2000 while MTU did not reach a low until 2003. The yield spread rose into 2003 while MTU did not push to a peak until three years later in 2006. The yield spread declined into 2006 and three years later- in early 2009- the cyclical trend (and MTU) once again moved to a low.
The problem is that for as compelling as this argument was… the relentless series of crisis that roiled the markets through 2011 kept MTU and the rest of the banks from swinging back to the upside. The charts suggest that the yield spread reached another peak between the end of 2010 and the second half of 2011 which, in turn, stretches the window for a banking sector/Japan/cyclical rally through 2013 and into 2014. For what it is worth, of course.
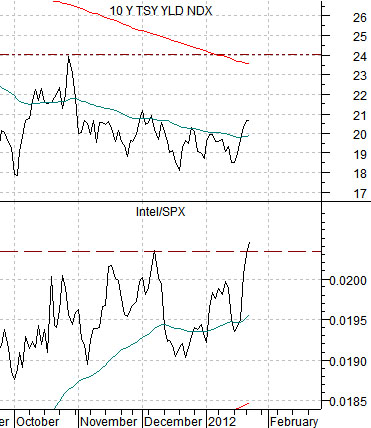
Below is a comparative view of 10-year Treasury yields and the ratio between Intel (INTC) and the S&P 500 Index (SPX).
Unless Intel has finally declined to valuation levels that make it trade like a defensive stock instead of a cyclical… the argument is that the large cap techs are leading the recovery. In other words a push to new highs by the Intel/S&P 500 Index was supposed to create upward pressure on 10-year yields.
We are not sure whether the chart makes an overwhelming case for this particular outcome but since it was something that we have focused on we thought we might as well update the picture.
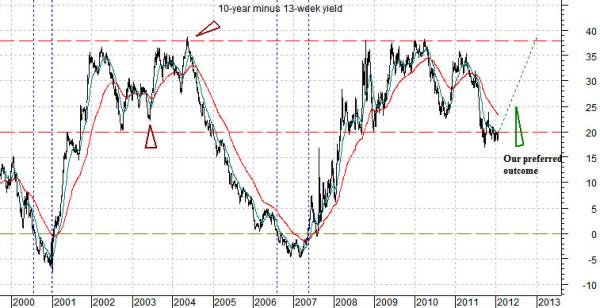
Below is a chart of the spread between 10-year and 3-month Treasury yields.
There are, more or less, three outcomes to consider. The first outcome is ‘more of the same’ as 10-year yields chop back and forth around 2% while TBill yields remain close to 0%.
The second outcome involves 10-year yields drifting down below 2% in a manner similar to Japan a decade or so ago. This is the slow-growth deflation outcome.
The third outcome consists of 10-year yields rising from current levels on improving growth. As yields move above 3.5% we would expect to see pressure on short-term yields. It might take as much as a year but in an inflation/growth outcome we would expect to see 10-year yields up to around 3.75% followed by the first of a series of rate hikes by the Fed.
To get from here to there, of course, would include a broadening of the cyclical recovery that has so far been driven in large part by the large cap techs.