We have been struggling somewhat with two very different theses and as we dig deeper into the second half of the year our sense of unease increases.
The first argument was that the cyclical trend follows the bond market by roughly two years. With bond prices rising sharply over the final six months of 2008- with most of the gains coming during the last quarter- the view was that following a mid-year consolidation we would see a sharp swing back towards growth. This was expected to carry asset prices higher into 2011.
The second argument has to do with something that we call the ‘decade trend’. One or more major asset price sectors has tended to rise to a peak during the first year of a decade with commodities reaching a high in 1980, Japan in 1990, and the Nasdaq in 2000. Our view was that if this tendency were to repeat we would see a surprisingly strong cyclical rally through 2009 leading into a peak and subsequent bear market in 2010.
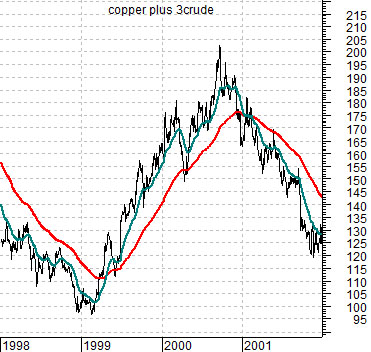
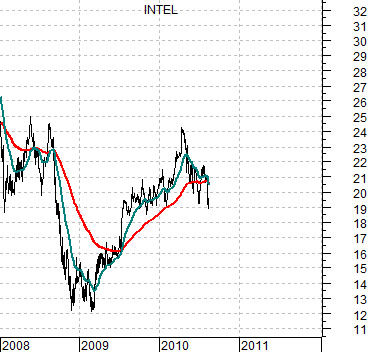
At top right we show the sum of copper and crude oil futures from 1998 through 2001 while below right we have included a chart of Intel (INTC) from 2008 to the present time period.
The most obvious point might be that if the tech sector fails to find some kind of footing in the very near future the moving average lines will ‘cross’ in a manner reminiscent to energy and base metals prices at the start of 2001. A reasonable case can be made that the rise in the bond market this year has been telling us that growth is slowing… rapidly.
We have attempted to rationalize our two arguments by suggesting that the best time for a cyclical price failure would be late in 2010. Combining this observation with the 2-year lag between the cyclical trend and the bond market helped create the foundation for our view that we should see one last burst of cyclical strength towards year end followed by a swing back towards a bearish trend.
Our problem is that the longer the bond market rises the greater the risk that the peak is now behind us. Any time the dollar begins to strengthen the pressures increase considerably although we suspect that yen strength is also an important variable. We have not changed our overall view but thought it appropriate to at least show how and where we may prove to be incorrect.
Equity/Bond Markets
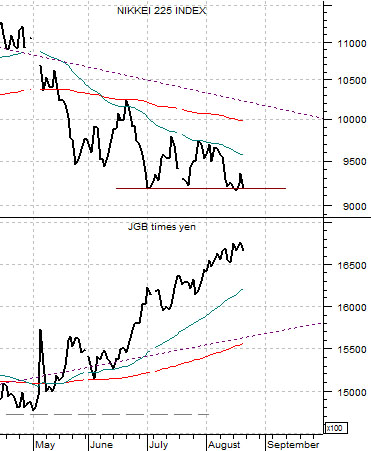
At top right is a chart of the Nikkei 225 Index and the combination of the Japanese 10-year (JGB) bond futures times the Japanese yen futures.
The Nikkei trends higher when the yen and/or the Japanese bond market trends lower. Ongoing yen and bond price strength has been a problem although through last week the Nikkei has managed to hold the lows set at the end of June.
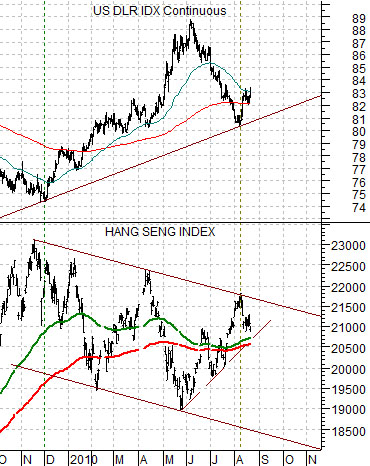
Below right we feature a comparison between the U.S. Dollar Index (DXY) futures and the Hang Seng Index from Hong Kong.
This is one of the charts that we have been watching closely over the past few months. The Hang Seng Index turned lower when the dollar began to rally last November. The index rose from channel bottom to channel top between May and early August on dollar weakness but has recently begun to correct as the dollar moved upwards.
The ongoing argument has been that the cyclical trend should remain positive as long as the two moving average lines on the Hang Seng chart do not ‘cross’. To date there is reason for cautious optimism although a solid break back below 20,500 would definitely be reason for concern.
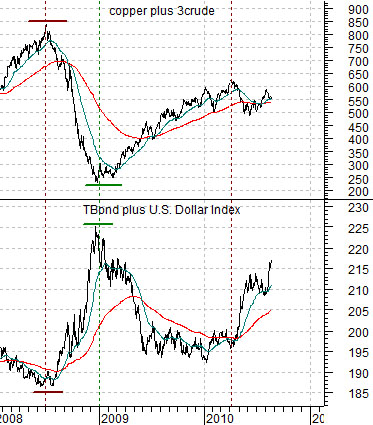
Below we have included a comparison between the sum of copper and crude oil and the sum of the U.S. 30-year T-Bond futures and U.S. Dollar Index (DXY) futures.
The basic point is that dollar and bond price strength during the second half of 2008 helped crater the commodities sector. The relentless rise in the bond market combined with recent dollar strength is bringing considerable pressure to bear on base metals and energy prices. Once again… there are reasons for optimism but as the days go by they are definitely beginning to feel a bit more like hope than reality.