U.S. crude oil inventories remain above the 5-year average, the Strategic Petroleum Reserve has effectively been filled (capacity of 727 million barrels versus current inventory of 724 million barrels), and OPEC production is on the rise. A recipe for lower oil prices? Not, apparently, in today’s world. In a market where a potential bumper U.S. grain crop can go with rising grains prices… all bets are off.
The markets keep crossing every ‘line in the sand’ that we can come up with. Our expectation was that equities would remain under pressure from May into August but the S&P 500 Index made new highs in July. We countered that confirmation of the rising trend would require new highs for the euro, new lows for the dollar, and an upside surge by the combination of commodity prices and long-term Treasury bonds and… the markets blew through our resistance points in a matter of moments.
We have two choices now. We can dig in and argue against the rising trend or we can choose the skuzzy option and suggest that the markets are doing exactly what we had forecast albeit somewhat ahead of schedule. Mental health and peace of mind suggest that we should choose the latter option while our inherent lean towards contrary thinking pushes us towards the former.
The end result will likely be some combination of the two. In other words when faced with two clear mutually exclusive options our response is to choose them both. We will continue to pick at the details while returning to arguments made frequently in the past that support exactly what the markets are doing at present.
On many occasions we have shown that the base cyclical trend tends to lag the trend for interest rates by two years. The idea was that when yields started to push higher in the spring of 2004 it would lead to a negative cyclical trend in the spring of 2006. On the other hand when yields collapsed in the summer of 2007 the 2-year lag suggested that we would swing back into a cyclical price recovery in the second half of 2009.
At top right we show the sum of 3-month and 10-year U.S. Treasury yields along with a chart of Japanese bank Mitsubishi UFJ (MTU). The charts have been offset by two years so that the upswing in yields in 2004 is lined up with the peak for MTU in 2006. The argument was that two years after yields finally began to decline in 2007 markets pressures would swing from negative back to positive.


Equity/Bond Markets
The argument above was that when yields begin to rise in response to economic strength- as was the case in 2004- it takes close to two years of increasing pressure before the cyclical trend turns negative. By extension pressures on the cyclical trend lead to economic weakness which then leads to falling yields. Once yields begin to decline the cylical trend remains negative for two years and then swings back to positive.
In any event the issue is that economic strength drives interest rates higher and economic weakness pulls interest rates lower. Fair enough. If economically sensitive sectors collapsed at the moment that interest rates began to rise then obviously interest rates would never push higher. Conversely if economically sensitive sectors recovered the moment that the Fed began to cut interest rates… interest rates would never decline.
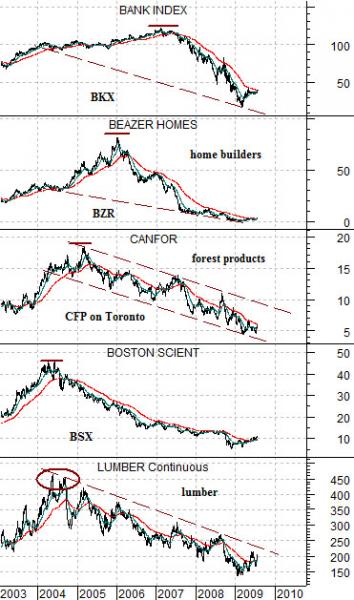
The point is that in any given cycle there are sectors that are so strong that they defy the negative impact of rising interest rates- for years- and there are sectors that are weaker that buckle on the first rate hike. With that in mind we move on to the chart at right.
The chart starts at the bottom with lumber futures and then continues to the share price of Boston Scientific (BSX), Canadian forest products company Canfor (CFP on Toronto), U.S. home builder Beazer (BZR), and the Bank Index (BKX).
When yields began to rise in 2004- two years before Mitsubishi UFJ turned lower and four years ahead of the final peak for most commodity prices- lumber futures (representing the weakest of the links) turned lower.
As lumber prices began to decline the weaker equity markets sectors- including BSX- began to weaken. Falling lumber prices created a negative trend for the forestry stocks by early 2005 and by the second half of that year the trend for the home builders had turned negative.
The argument is that economic strength focused primarily in energy and metals prices began to push interest rates upwards in 2004 and over the next few years lumber prices, the forest products sector, and then the home builders turned negative. Once the major U.S. financials- highly levered to real estate-related investments- began to buckle in the 2007 the trend for interest rates turned lower helped along a year later by an utter collapse in the commodity markets.
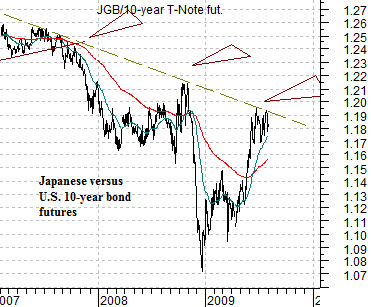
We argued recently that strong commodity prices and Asian growth keep pushing U.S. interest rates higher even though the larger trend favors lower yields. In other words for the past decade long-term U.S. yields have been pushing down towards Japanese yields so each time commodity and Asian or BRIC-related growth moves U.S. yields upwards a crisis develops.
The chart below shows the ratio between Japanese and U.S. 10-year bond futures. The financial system broke lower in 2007 and the commodity sector busted in 2008 when the ratio got ‘too high’. If the trend is still intact then one of two things has to happen- either Japanese yields rise sharply or U.S. yields have to decline. Either way the eventual outcome will likely drive the Japanese yen higher against the dollar in a manner similar to the second half of both 2007 and 2008.