We have the sense that there is still a bit of unfinished business left for the markets.
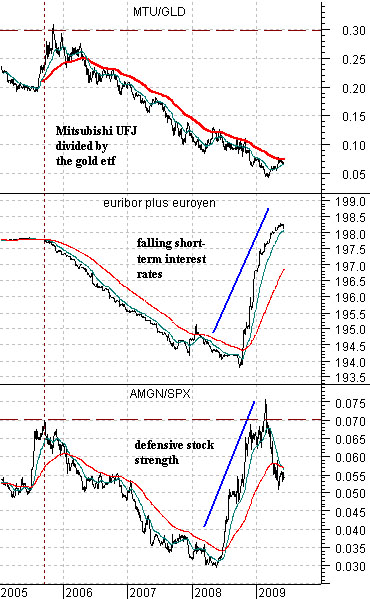
Belowwe show a comparison between, from top to bottom, the ratio of Japanese bank Mitsubishi UFJ (MTU) to the gold etf (GLD), the sum of 3-month euribor (short-term Euro debt) and 3-month euroyen (short-term Japanese debt) futures, and the ratio between the share price of biotech Amgen (AMGN) to the S&P 500 Index (SPX).
The cycle began in late 2005 as rising short-term interest rates (falling euribor and euroyen prices) worked to offset building commodity markets strength. In other words the ratio between Amgen and the SPX started to decline as capital pushed into commodity-based themes and away from the various commodity-user themes.
The end result was a declining or negative trend for the MTU/GLD ratio. We have explained in previous issues that the reaction to rising short-term yields in Japan was, by the spring of 2006, falling long-term yields which served to flatten the yield curve while telling those paying attention that Japanese growth was slowing.
The charts have been set up to suggest a sequence of sorts. The first reaction by the equity markets was to drive the relative prices of the non-commodity stocks higher. This shows up through the rapid escalation of the AMGN/SPX ratio through the second half of 2008.
The second wave involved rapidly rising short-term debt prices as commodity price declines helped bring short-term yields back to or below the levels of 2005.
Our expectation has been that the third wave will include gold price weakness. Through the crisis money headed into the U.S. dollar, Japanese yen, Treasuries, and gold. However, over the past few months the dollar has declined, the long end of the Treasury market has almost collapsed, and the yen has stabilized. Of the four capital destinations the only one that is still near the highs is gold.
The argument is that the pressure that began to build in 2005 will not truly be over until the MTU/GLD ratio snaps back above its moving average lines on the way- potentially- back up to the levels of late 2005 and early 2006.
Belowis a chart comparison that we ran on the 5th page of yesterday’s issue. We have tightened up the time frame somewhat because we wish to examine a few of the details.
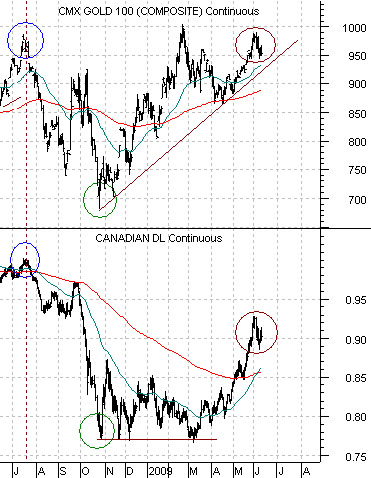
The argument is that the U.S. 30-year T-Bond futures and Japanese yen served as destinations for risk averse capital. The trend for gold, however, appears to be lagging the combination of the TBonds and yen by roughly 3 months.
The TBonds times yen peaked in March of 2008. With a 3-month lag this should have indicated a declining trend for gold prices starting in June but the chart shows that gold prices made a final spike towards 1000 before breaking sharply lower.
The bottoms line up nicely as the TBonds times yen turned upwards in August while gold began to strengthen in November. In any event our thought was that the recent spike back towards 1000 for gold futures appears more than a bit reminiscent of last year’s summer rally. If so then the earliest that we would expect to see a bottom for gold prices would be late in this year’s third quarter.
Below we compare the Canadian dollar (CAD) futures with gold futures to put this into some form of perspective. When gold prices drove to a high in July of last year the CAD was close to .9900 and by the time gold prices bottomed this currency was roughly .7700. The point is that we can see stronger gold prices as long as the Cdn dollar is making new highs and the U.S. dollar is making new lows but if the cycle rolls over with gold prices moving back into the 700’s one has to expect pressure on the commodity currencies.
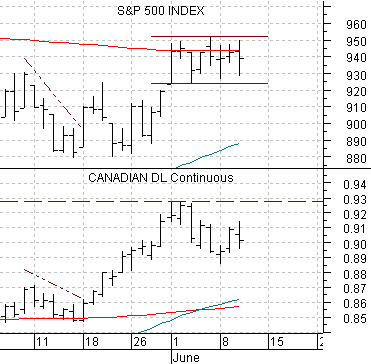
This brings us to the final point- the current relationship between the Cdn dollar and the S&P 500 Index. In the short run the trends are almost identical. The SPX has recently run into resistance at its 200-day e.m.a. line (around 945) and this has gone with the sideways consolidation or, perhaps, top for the Cdn dollar. If the CAD breaks above .9300 it suggests that the SPX will extend its rally as well.