The so-called Law of Unintended Consequences argues that any cause has more than one effect and any action usually includes one or more unintended and usually unwanted consequence. In other words… you should be careful what you wish for. Such was the case for us with regard to one of our older arguments revolving around the relative strength of energy prices.
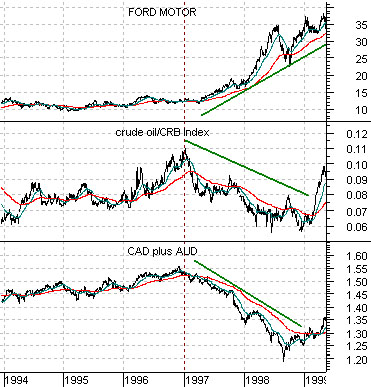
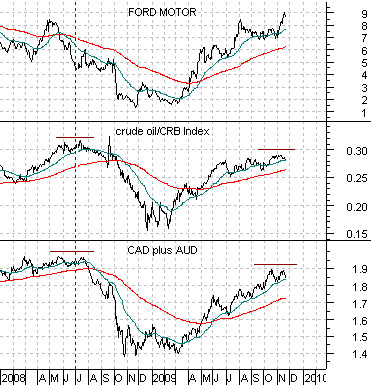
The idea comes- at least in part- from the chart below. This chart offers a comparative view of the share price of Ford (F), the ratio of crude oil futures to the CRB Index, and the sum of the Canadian and Australian (CAD plus AUD) dollar futures.
At the start of 1997 a number of trends began to change. This was the relative strength high point for energy prices (i.e. the crude oil/CRB Index ratio peaked and turned lower), the start of a two-year down trend for the commodity currencies, the upward pivot for the share price of Wal Mart (WMT), and the general point in time when the autos and airlines began to drive or fly higher.
Now… at the peak in 1997 the ratio of crude oil to the CRB Index reached 11% only to fall in half through 1998 to less than 6%. As the ratio declined the Asian, Latin, and emerging markets themes turned negative ultimately leading to the Asian Crisis during the second half of 2008. The offset through this correction was price strength in the autos and airlines as well as WMT. Fair enough.
Below we show the same comparison. Notice that by mid-2008 the crude oil/CRB Index ratio had risen to more than 30%, the commodity currencies had reached a major peak with the sum just above 2.00 (meaning that, on average, the Canadian and Australian dollars were trading above parity with the U.S. dollar), and the autos were on the fast track to bankruptcy. Our argument was that if WMT turned upwards- as it did towards the end of 2007- followed by weakness in the crude oil/CRB Index ratio and commodity currencies then we had reached a point in time when the BRIC theme would shift into a lengthy correction, the autos and airlines would swing positive, and the U.S. dollar would be taken off life support.
The detail that we apparently missed was that the only thing capable of slowing the relative strength ascent of energy prices was a complete banking system collapse. Instead of a recovering trend for WMT and F what we got was a stock market melt down followed by yet another push back towards the highs for the commodity and BRIC themes. An unintended consequence indeed.
Equity/Bond Markets
Above we showed how a peak for energy prices relative to the CRB Index and the highs for the commodity currencies led to a 2-year correction in Asian growth during 1997 and 1998 that was offset, at least in part, by strength in the auto stocks.
Energy prices peaked relative to the CRB Index in 2008 but as the U.S. dollar turned upwards the financial markets imploded. After a furious rally through much of this year it is possible that a similar set up has taken place once again. The question is… can weakness in energy prices lead to a positive outcome or are we doomed to repeat last year’s outcome?
The answer, in our view, lies with the large cap consumer and health care stocks.
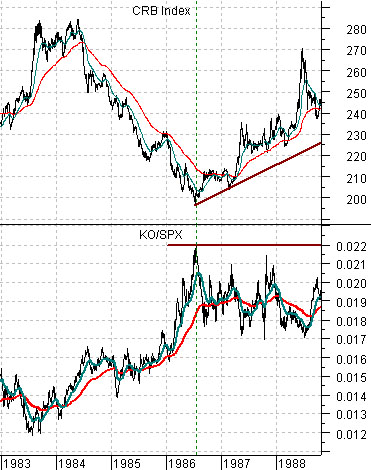
Below we show the CRB Index and the ratio between Coca Cola (KO) and the S&P 500 Index (SPX) from 1983 into 1988.
The argument is that as long as the KO/SPX ratio is rising… the trend for commodity prices is negative.
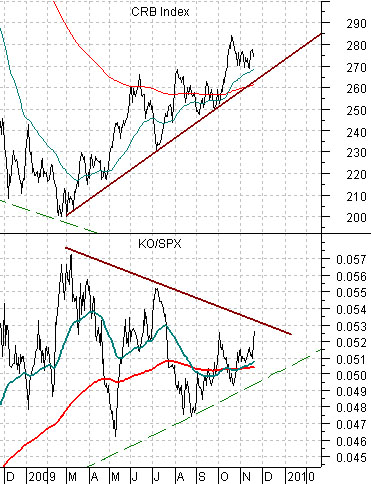
Below we show the comparison for the current time frame. We suggested a month or three back that when the moving average line for the KO/SPX ratio converge… a decision point has been reached. If the ratio breaks to the down side then higher commodity prices lie ahead but if it swings back to the upside then we should be entering the second stage of the correction for raw materials prices.
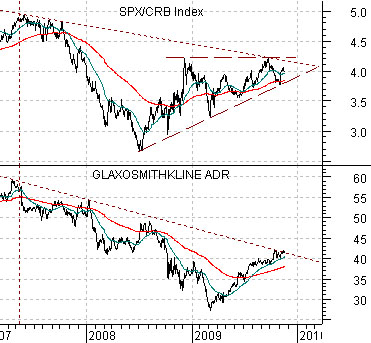
Below is a comparison between GlaxoSmithKline (GSK) and the ratio between the S&P 500 Index and the CRB Index (equities vs. commodities).
We do not know whether a few cents plus or minus ‘42’ will make much of a difference but if GSK manages to push up through this number then the long down trend may have come to an end. If so… then the equity/commodity ratio should resolve higher leading to a stronger bond market and lower long-term Treasury yields. In other words… we are ‘that close’ to bringing to an end the justification for holding commodities as long-term positions in portfolio accounts.