We are going to show an assortment of perspectives today.
Our focus of late has been on the way potential trends for the bond market could impact the equity markets. We thought we would start off today with a bullish equity markets comparison.
Through the month of April bond prices have risen as 10-year Treasury yields drifted back from 4% to around 3.73%. This one month bond price rally serves as the ‘anchor’ for the comparison at right.
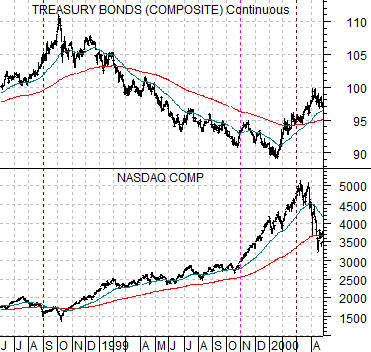
The chart below compares the U.S. 30-year T-Bond futures with the Nasdaq Composite Index from mid-1998 into the spring of 2000.
The argument is that the Nasdaq’s ‘bubble’ into 2000 began with falling bond prices and ended a couple of month after bond prices finally turned back to the upside. Along the way the bond market staged a number of price rallies with one in particular- from October into November in 1999- catching our attention.
After pushing up towards the 200-day e.m.a. line bond prices turned back to the down side during the fourth quarter of 1999. This went with a powerful acceleration in the rising equity markets trend that helped to almost double the value of the Nasdaq from October of 1999 into March of 2000.
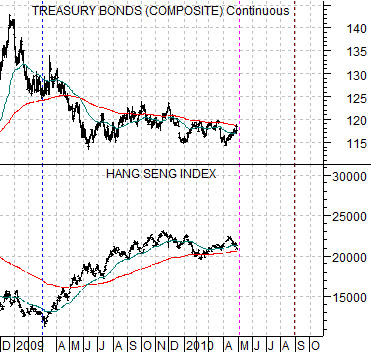
Below is a comparison between the U.S. 30-year T-Bond futures and the Hang Seng Index from Hong Kong for the current time frame. The chart has been lined up with the one above based on the start of the bullish equity markets recovery in March of 1999 (compared to September of 1998) and minor bond price rally/equity price dip through April (compared to the Nasdaq in October of 1999.
The point is that if bond prices were to pivot back to the down side in the days to come the equity markets could swing powerfully higher through into late summer.
Our point, we suppose, is that if the Asian markets surprise to the upside over the next month and the bond market responds by heading lower a case can be made for a liquidity-driven extension of the rally that would carry the bullish trend through into the autumn.
Equity/Bond Markets
With bond prices trending higher through April our thoughts have turned to the topic of ‘momentum’.
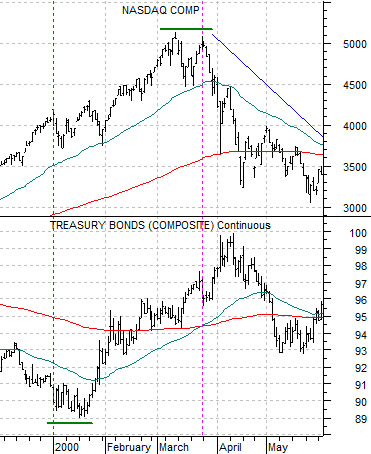
The chart below compares the Nasdaq Composite Index with the U.S. 30-year T-Bond futures from the end of 1999 through May of 2000.
As best we can we try not to argue with the bond market. While bond prices can reverse direction for any number of reasons key trend changes often have much to say about the health of cyclical growth. In January of 2000, for example, bond prices began to rise in anticipation of a sharp decline in economic activity later in the year.
The key here is that the bond market turned higher in January while the Nasdaq did not reach a peak until March. The equity markets were actually supported by falling interest rates for a couple of months before the ‘reason’ yields were falling became more apparent.
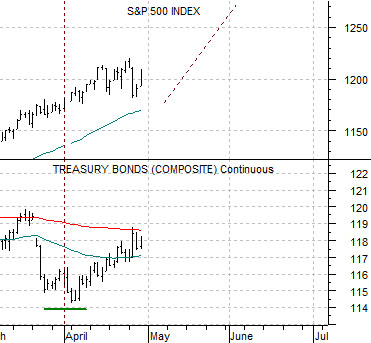
Below is a comparison between the S&P 500 Index (SPX) and TBond futures from the end of 2008 through May of 2009.
When the bond market turned lower at the end of 2008 the message was the growth was beginning to strengthen. Yet the equity markets were still being bombarded with negative news so the decline in bond prices helped to push the SPX to new lows into March. Once again, however, the pivot in the bond market forecast a directional change for the equity market while also accentuating the ongoing trend.
Lastly is a comparison between the SPX and the TBond futures from the current time period.
Our argument is that IF the TBond futures made a major trend change at the start of this year’s second quarter THEN the message would be that growth is slowing. Based on the two comparisons shown on this page the equity market could actually accelerate to the upside through the month of May as the flow of good news stacks up on top of the positive impact of falling long-term yields. If history were to repeat this would lead to an equity markets peak around late May or early June.