We are going to concentrate on a couple of similarities to the post-1990 markets on the first two pages today.
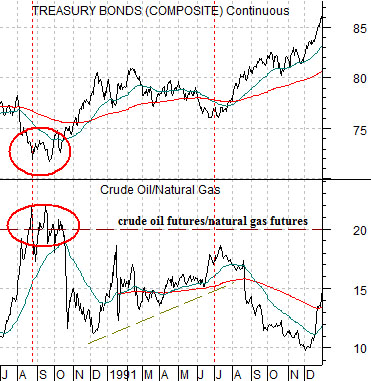
Below is a comparison between the U.S. 30-year T-Bond futures and the ratio between crude oil and natural gas futures from July of 1990 through December of 1991.
One of our arguments in the past has been that the ratio between crude oil and natural gas tends to swing to a peak above 20:1 down to a low under 7:1. To put things into perspective with crude oil around 81 and natural gas close to 4.57 the ratio ended yesterday just above 18:1.
Aside from the fact that over time crude oil prices tend to rise and fall relative to natural gas prices the argument is that when the oil/gas ratio moves above 20:1 it tends to mark a low point for long-term Treasury prices. Conversely when the ratio moves below 7:1 it tends to mean that the bond market has reached a high for prices.
Our comparison begins in the autumn of 1990 at the low point for the equity markets. The ratio between crude oil and natural gas rose to a peak above 20:1 concurrent with a bottom for the long end of the bond market.
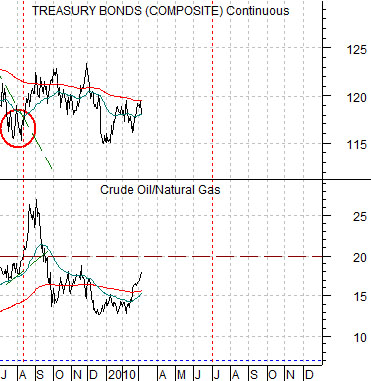
Fast forwarding to the current time frame we can see through the chart below right that the ratio spiked back above 20:1 in the late summer of 2009.
We have argued on many occasions that one of the more interesting details within the markets in recent years is the tendency to push yields higher through the first half of the year before switching to a lower yields/stronger bond market trend over the final six months.
In any event… our expectation has been that bond prices will remain under pressure through the second quarter before swinging back to the upside during the second half of the year.
Our thought is that the 1990- 91 comparison serves as a nice visual representation of what we have been looking for over the balance of the year; relative strength by crude oil compared to natural gas coupled with a downward bias for long-term bond prices.
Equity/Bond Markets
1990- 91 had its Savings &Loans crisis and the Resolution Trust while the recent cycle involved the Sub-Prime crisis and TARP. Whether the two time periods are at all comparable is open to question but from an intermarket point of view we can certainly find some compelling similarities.
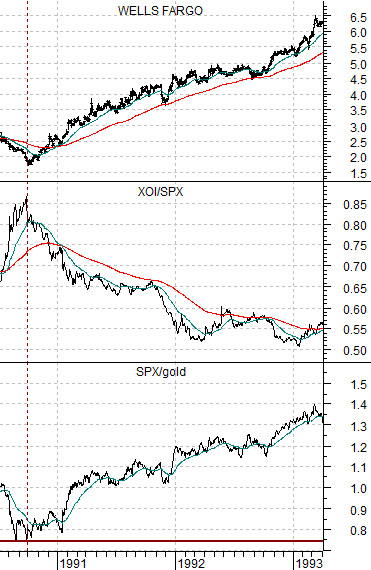
Below is a chart comparison made up of the share price of Wells Fargo (WFC), the ratio between the Amex Oil Index (XOI) and S&P 500 Index (SPX), and the ratio between the SPX and gold prices. The chart covers the time period between mid-1989 and the end of the first quarter of 1993.
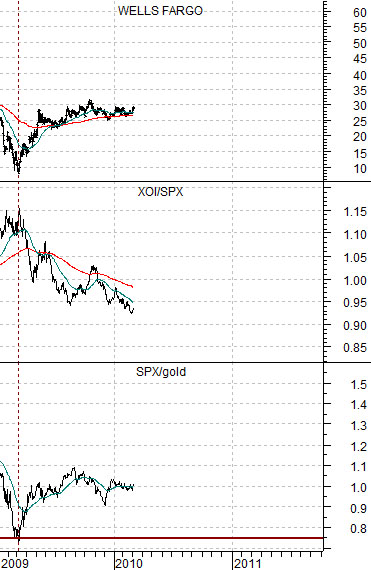
We show the same comparison starting from the beginning of 2009 below right.
Starting with the SPX/gold ratio the idea is that at the bottom for the equity markets in 1990 the level of the SPX declined to 75% of the price of gold. At the final bottom for the equity markets in March of last year the S&P 500 Index declined once again to… 75% of the price of gold.
So the anchors for this comparison are the two instances when the SPX/gold ratio fell all the way down to .75.
In the autumn of 1990 as the SPX/gold ratio bottomed at .75 the ratio between the oils (XOI) and the broad market (SPX) reached a peak. At the same time the share price of Wells Fargo hit a major cycle bottom.
The argument is that in March of 2009 the SPX/gold ratio reached the same low as the autumn of 1990 while the ratio between the oils and broad market also rose to a major cycle top. At the same time the share prices of the financials hit bottom along with the broad U.S. stock market.
If we can argue that there are similarities between the autumn of 1990 and the spring of 2009 then we can push forward with our comparison.
The point that we have yet to make is that once the markets changed trends in 1990 the ensuing trend did not change until some time in early 1993. In other words the recovery that began at the pivot point in 1990 continued for a full 2 1/2 years through the first quarter of 1993.
If history were to be kind enough to repeat- even in a broad sense- then the future through into 2011 is… more of the same. More strength by the equity markets relative to gold, more weakness by the major oils compared to the broad market, and an ongoing rally in the major financials.