We were wondering today whether there was any kind of ‘standard’ length of time that the equity markets rallied following a major thrust to the upside. In other words when the stock market hits bottom and swings back into a bullish trend is there a point in time when the initial momentum begins to fade?
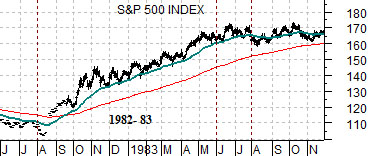
Below are four charts of the S&P 500 Index (SPX). The charts show the time frame through the stock market bottom in 1982, the end of the Asian crisis in 1998, the bear market lows of early 2003, and- at bottom- the present time period.
This is the sort of comparison that may or may not provide insight and, to the extent that any information can be gleaned, is likely good plus or minus a month or three. Aside from that… there actually does seem to be enough of a repetitive pattern to make this worth the effort.
Following the bullish pivot in August of 1982 the S&P 500 Index ‘walked up’ the 50-day exponential moving average line through into the summer of 1983. The initial thrust lasted at least nine month with the index beginning to flatten out around the 11th and 12 month.
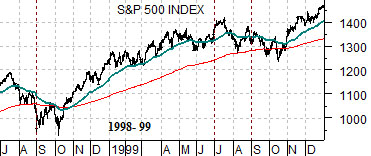
With a bottom made in the autumn of 1998 the stock market pushed higher with the 50-day e.m.a. line acting as rough support into May of 1999. In other words a good 9 months of upward thrust with momentum starting to fade in the 11th and 12th month.
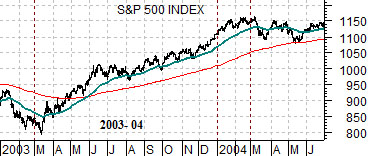
The bottom in 2003 led to a somewhat longer rally that extended through into early 2004. The initial highs were reached in the 11th and 12 months (i.e. January and February of 2004).
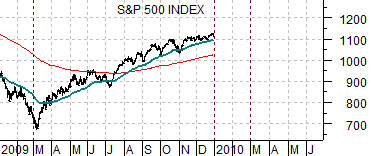
The point? In terms of ‘time’ the stock market rally that began in March of 2009 is getting just a bit old in the tooth as it enters is 11th month. If history were to repeat the upward thrust that has carried the broad market higher from last year’s lows should begin to weaken somewhat as we push through the first two months of the year.
As a side note… the bond market rallied during August and September of both 1983 and 1998 as well as January into March of 2004. The argument being that once the cyclical trend begins to consolidate the offset should be a couple of months of stronger long-term Treasury prices.
Equity/Bond Markets
We are actually doing this one somewhat backward given that the supporting chart is on today’s third page but the argument starts with the idea that close to nine months before the commodity markets collapsed in 2008 the Chinese stock market turned lower. In fact this lead-lag behavior showed up back in 1990 when the Japanese stock market tumbled at the start of the year close to nine months ahead of the eventual peak for crude oil prices in October.
The premise is that a significant decline for commodity prices in general and energy prices in particular has, in the past, been preceded by some for of Asian equity markets weakness.
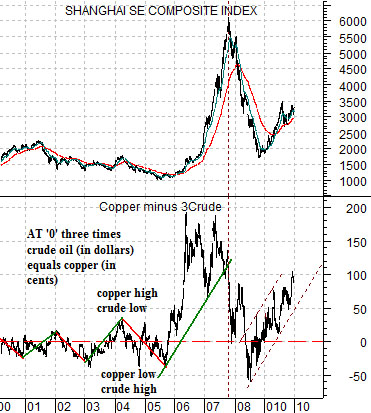
Below we show the Shanghai Composite Index and the spread between copper futures prices (in cents) and crude oil futures prices (in dollars time three).
The idea is that through the decade the relationship between copper and crude oil has swung back and forth through the ‘0’ line. In other words with copper currently trading around 3.40 (340) the price of crude oil would have to rise to around 113 (113 times 3 equals 339) to pull the spread line back to ‘0’.
The next point is that any trend that features significant outperformance by copper prices (i.e. a rising spread line) will tend to reflect powerful Asian growth. The stronger copper is relative to crude oil the higher the Shanghai Comp. tends to push. Fair enough.
The issue that we were pondering yesterday as crude oil futures pushed back above 80 is… will we see triple-digits for crude oil prices some time during the first half of this year? As mentioned on many occasions in the past the markets have tended to focus on the strong energy price theme through the first half of the year before shifting over to a weaker trend that helps pull yields lower through the back half of the year.
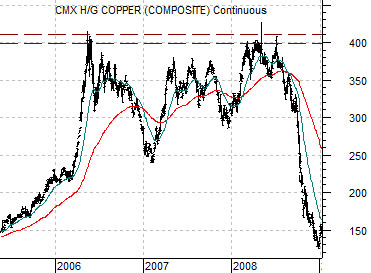
The ‘triple-digits’ thought comes from the dance that copper and crude oil worked through between 2006 and 2008. At middle right is a chart of copper futures which shows that for close to three years copper prices kept hammering up to the 4.00 range.
With copper setting a high at 4.00 the theoretical upside projection for crude oil was roughly 135 (135 times 3 equals 405). In the late summer of 2007 with the Shanghai Comp. screaming up towards 6000 as crude oil prices held below 80 the possibility of 135 oil prices seemed somewhat remote.
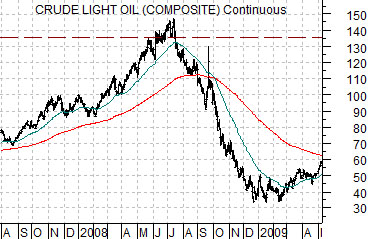
Our point is that just ahead of the peak for the Chinese stock market the spread between copper and crude oil prices began to tumble. Even as the commodity markets pushed on to new highs the spread declined rapidly until the spread had not only returned to the ‘0’ line but had over shot it to the down side. At bottom right we show a chart of crude oil futures for this time period to make the case that prices most certainly managed to rise to and then through the 135 level.
Our concern is that the longer the rally runs for copper prices and the closer it gets to the 4.00 level the greater the odds that crude oil prices will eventually rally to test last year’s highs. In a strange way this could lead to a very nice set up for the autos as consumers would be presented with the next generation of electric vehicles this autumn right in the teeth of a return to the highs for gasoline prices.