The problem with the markets in late August is that it usually feels as if something important is set to happen. With so many traders away from their desks, however, the days tend to drift quietly by until we finally get on the other side of the Labor Day weekend.
In any event… we thought we would shift away from our usual habit of dealing with what might be and focus instead on what is actually happening within the markets.
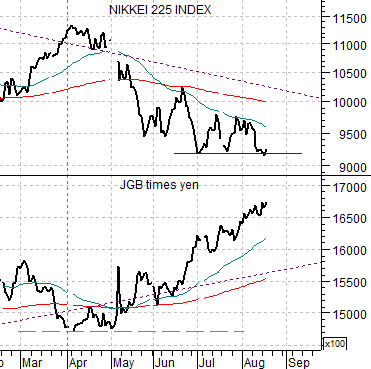
Below is a comparison between Japan’s Nikkei 225 Index and the combination of the Japanese 10-year (JGB) bond futures times the Japanese yen futures.
From the start of this year’s second quarter the trend has included strength in bond prices and the yen. The Nikkei tends to trend in the opposite direction so it has been grinding lower as an offset.
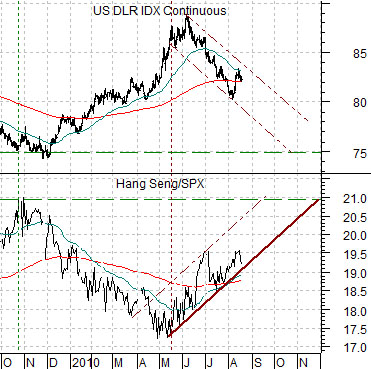
Further belowwe show a chart of the U.S. Dollar Index (DXY) futures and the ratio between Hong Kong’s Hang Seng Index and the S&P 500 Index.
This is an intriguing view. The U.S. dollar tends to trend inversely to the Hang Seng/SPX ratio so from some time back in May to the present time period the decline in the dollar has helped to strengthen Hong Kong’s equity market.
The reason we are showing both of these charts on the same page is that they tell very different stories. The Nikkei is clearly trending lower as money apparently moves towards the safety of the yen and the bond market. Fair enough.
The Hang Seng, on the other hand, is on the rise both in absolute terms and relative to the SPX as money shifts away from the safety of the dollar and back towards riskier themes.
While we may not be able to draw a mind-boggling conclusion from these two perspectives the thought is that dollar weakness is helping to create a stronger cyclical trend even as yen and bond markets strength project the impression that growth is slowing rapidly. At present ‘growth’ still appears to be centered on the ‘China’ theme as copper prices and the commodity currencies firm. A better showing from Japan may have to wait until the yen and the bond market finally turn back to the down side.
Equity/Bond Markets
We are going to beat this topic to death. We may have already done so but won’t stop us from taking out a shovel and giving a few more whacks today.
The topic has to do with the 2-year lag between the bond market and the cyclical trend. A strong cyclical trend tends to create equity and commodity markets strength during those periods of time when the markets are more concerned by deflation than inflation.
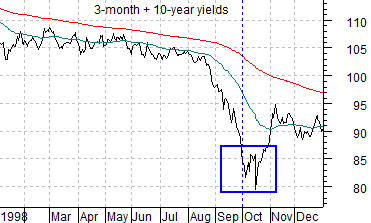
Belowwe show a chart of the sum of 3-month and 10-year Treasury yields from 1996 and the S&P 500 Index from 1998. The argument is that the peak for yields in 1996 lined up with the bottom for equities two years later in 1998.
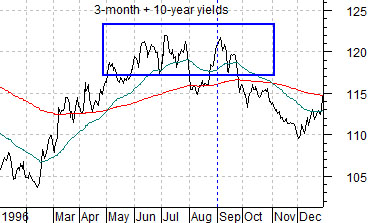
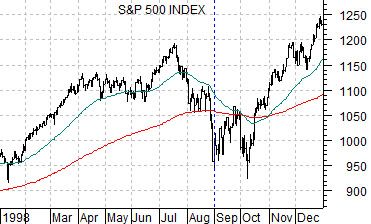
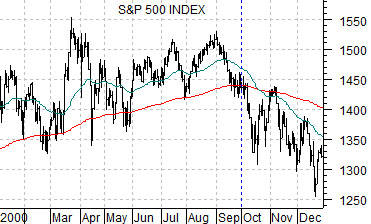
Next we have included yields from 1998 and the SPX from 2000. If there is roughly a 2-year lag between directional changes for yields and the equity markets then the bottom for yields in 1998 led to the end of cyclical strength in the autumn of 2000.
If this isn’t all mere coincidence (and we have done our best to show a number of past examples to make the case that it may not be) then the bond market in 2008 might be relevant to the trend for the equity markets this year.
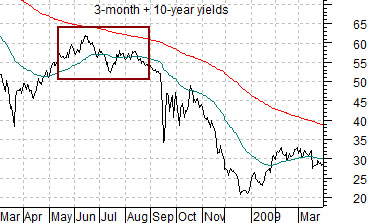
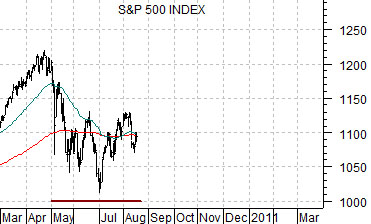
At bottom we show the sum of 3-month and 10-year yields from March of 2008 through March of 2009 along with a chart of the SPX from March of 2010 to the present day. The point we are attempting to make is that the rally for yields into the summer of 2008 lines up nicely with the recent slump in the equity markets. As we push through into the autumn, however, the relationship argues that the cyclical trend should strengthen as we move towards year end.