We have argued that the U.S. stock market has exhibited a Japan-like tendency since some time in 1998. The Japanese stock market shifted over to a trend early in the 1990’s where gains were only made when yields were rising. Given that Japanese interest rates have been falling for more than 2 decades this created a broad trend of long declines and sharp but short rallies.
By the end of the 1990’s the U.S. stock market started to follow the same basic path. When cyclical growth was strong enough to push yields higher the stock market moved upwards but when yields inevitably began to decline prices went virtually into free fall.
Our view was that this was part of a macro process of compressing valuations and that eventually this behavior would change. Lower yields are actually a positive for financial asset prices so when valuations shrink far enough stocks and bonds would be expected to trend in the same direction once again.
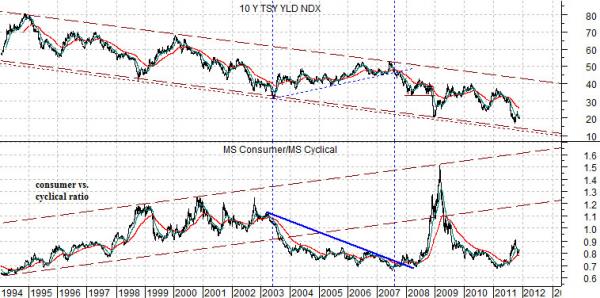
In any event… from time to time we run the chart below. The chart compares the trend for 10-year Treasury yields with the ratio between the Morgan Stanley Consumer Index and Cyclical Index.
The chart makes the rather simple case that yields are still firmly entrenched in a declining trend and if the channel bottom is reached once again over the next few months or quarters we could see 10-year Treasury yields at or below 1.5%.
The consumer/cyclical ratio trends inversely to yields so each time yields turn lower there is either downward pressure on the cyclical sectors or upward pressure on the consumer sectors.
In years gone by the consumer stocks would rise with yields but in recent years all that we have seen is outperformance (i.e. a rising consumer/cyclical ratio) simply by falling ‘not as much’.
If there is a shoe left to drop it may well be a repeat of the upward spike by the ratio back into its rising channel. Our hope has been that the stable dividend streams offered by the consumer staples in a world starved of investment income would be enough to offset the bearish pressure of slowing Asian growth and the all-too-frequent bout of Eurozone crisis. Our worry is that it will take yet another commodity markets collapse and upward moon shot by the dollar to get us back to a more bullish trend.
Equity/Bond Markets
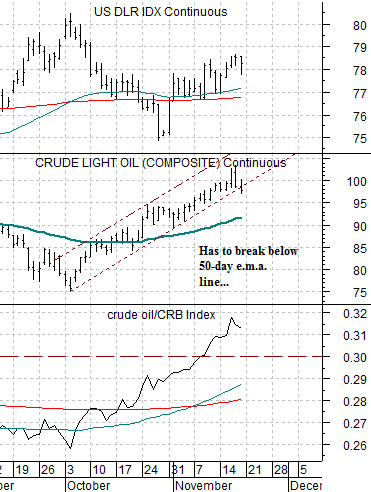
If we were to attempt to explain why the markets are so choppy these days in a single sentence one way to do so would be to argue that oil prices are caught between being ‘too high’ and ‘not low enough’.
The argument has been that the rise above .30 by the crude oil/CRB Index ratio has typically gone in recent years with the impending peak for the energy trend. With the oil stocks lifting the broad indices and carrying many sectors higher the removal of this kind of bullish sponsorship acts as a bearish weight.
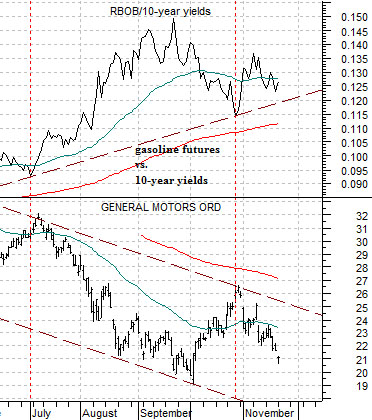
On the other hand the energy ‘users’ are still under pressure from this year’s relentless upward push for fuel costs. We have been using a couple of different comparisons to explain this including the ratio between Brent crude and the CRB Index as well as the ratio between gasoline (RBOB) futures and 10-year Treasury yields.
The chart below compares the RBOB/10-year yields ratio with the share price of General Motors (GM).
In essence the argument is that oil prices have risen to the point where the oil stocks have run out of bullish price momentum but have not fallen far enough to turn the trend positive for the energy ‘users’. The end result is a choppy markets environment searching either for reasons to push oil prices higher or drive then substantially lower.
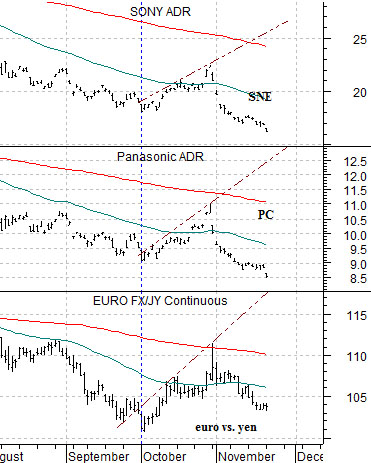
Another problem is that the euro remains weak while the Japanese yen is still stronger. The downward pressure on the cross rate between the euro and yen is a dead ringer for the price pressure on the major Japanese exporters. We show the comparison between the euro/yen cross rate and the share prices of Sony and Panasonic below.