
We are sure that there are worse things than owning stocks declining in price during a bull market. Being ravaged by a rabid badger comes to mind as an example. Yet there is just something about being on the wrong side of the trend that heaps insult upon injury. Especially if the trend is hot enough and obvious enough that most of your friends and neighbors are benefiting from it.
Every now and then markets move into price bubbles. The experienced investor recognizes the bubble-like action and heads for the hills knowing that these kinds of things always end badly. Prices, of course, continue to rise with fortunes being made almost daily until retail brokers start to hide beneath their desks in case another client calls to ask why he or she wasn’t positioned in all the obvious (i.e. parabolic) places. In our view trends begin when no one is watching, gain momentum when other things are going on, and become a bit more obvious quarters or even years later. Given our contrary natures some time around the onset of ‘obvious’ we tend to start looking for other things to do.
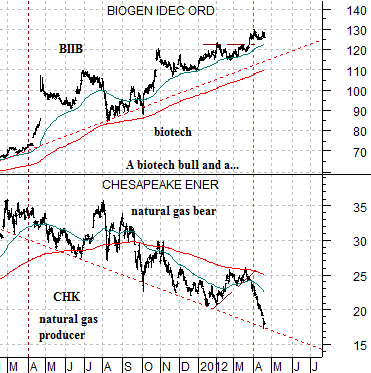
Below is a chart that we have included in the back pages on a few occasions in recent months. The chart compares the share price of biotech Biogen (BIIB) with that of natural gas producer Chesapeake (CHK).
The chart suggests that the trend for biotech went bullish back in the spring of 2011 as the underlying energy trend changed to bearish. We suspect that even a year later very few are actually aware that the direction of the flow of capital changed in this manner. Perhaps Glaxo’s take over bid for Human Genome (HGSI) yesterday will make this a bit more obvious.
Next is a chart comparison between medical products maker Boston Scientific (BSX) and the ratio between Brent crude oil futures and the CRB Index.
We have argued (on far too many occasions) that the price trend for BSX turned bearish way back in 2004 as energy prices began to truly gather momentum to the upside. A full year after the energy stocks started to weaken within the equity markets we are still dealing with the relative price strength of Brent crude. The flip side or offset to this has been- for years- weakness in an assortment of sectors. While BSX moving back up towards 6 is not exactly a significant event from a longer-term perspective it is the sort of thing that we would expect to see in the early stages of a trend change.

Equity/Bond Markets
What we are looking for is a trend to develop that will favor both the banks and the energy ‘users’. We use the word ‘favor’ because we are dealing with ratios based on price action relative to the S&P 500 Index.
Below is a comparison between the ratio of Brent crude to the CRB Index, Carnival (CCL) to the SPX, Ford to the SPX, the Bank Index (BKX) to the SPX, and the price spread between the U.S. Dollar Index (DXY) futures and the U.S. 30-year T-Bond futures.
Cutting to the chase… this is only going to work if two things happen. First, the price of Brent crude oil has to turn lower relative to the CRB Index. This will help remove the pressure from rising fuel prices currently weighing on stocks such as Ford and Carnival.
Second, the dollar has to strengthen relative to the bond market. Ideally this would include a flat to rising dollar and a clear down trend for bond prices. In recent days the bond market has been stronger which has set the trend change back somewhat. Keep in mind that one of the keys associated with strength in the banking shares is falling bond prices.
So… the argument is that if we get dollar strength then crude oil (and gold) prices will come under pressure. If we get bond price weakness then the markets will be ‘saying’ that this is viewed as a cyclical positive.
Below is a chart of the ratio between crude oil futures and the CRB Index along with the ratio between Canadian airline WestJet (WJA on Toronto) and the broad Cdn stock market (S&P/TSX Comp.)
Between 2000 and the end of 2003 the share price of WJA rose against the Cdn dollar as the crude oil/CRB Index traded beneath the 2000 highs. The trend went positive for energy prices in 2003- 04 which has kept the price of WJA close to .001 of the Cdn stock market. Ideally the crude oil/CRB Index ratio starts to weaken allowing the WJA/TSX ratio to move up toward .0017 or even .0025.


