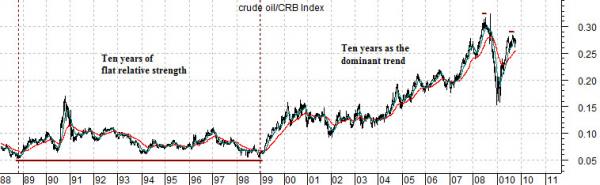
To start things off today we are going to take a look at the chart below of the ratio between crude oil futures prices and the CRB Index. The chart runs from 1988 to the present day.
The argument is that over a ten year period from 1988 through 1998 the price of crude oil held relatively flat when compared to general commodity prices. The crude oil/CRB Index ratio spiked higher during the lead up to the 1990 Gulf War before declining once again.
At the end of this decade-long trend the markets were mired in crisis following and Asian crisis that rolled through both Russia and Brazil in early 1999. The end of ten years of relatively ‘flat’ energy prices marked the bottom for virtually everything associated with the BRIC-related themes.
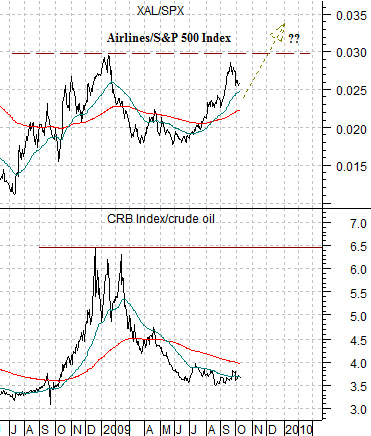
Many believe that energy prices in particular, commodity prices in general, as well as Asian, Latin, and emerging markets growth will dominated the trend for years to come. We counter that markets tend to work in cycles instead of straight lines so our contention is that the crude oil/CRB Index reached a peak in 2008 during our most recent period of crisis. Our view- turning the ratio upside down to show the CRB Index divided by crude oil futures prices at top right- is that the only way the Airline Index (XAL) divided by the S&P 500 Index (SPX) should rise to new recovery highs is if the relative strength peak for energy prices was reached during the summer of last year. In other words… the XAL/SPX ratio up through .03:1 should mark the end of ten years of relative strength for energy prices.
Equity/Bond Markets
Above we showed the ratio between crude oil futures prices and the CRB Index. The argument is that the ratio peaked in 2008 after a decade’s worth of strength. What would negate, refute, and otherwise obliterate our argument would be new highs for the crude oil/CRB Index ratio.
The ratio is part of a larger trend that includes everything from the U.S. dollar to relative strength by the U.S. equity markets to the ratio between ‘tech’ and base metals prices.
IF the crude oil/CRB Index ratio is going to make new highs validating the views of the commodity bulls THEN the U.S. Dollar Index (DXY) will likely make new lows.
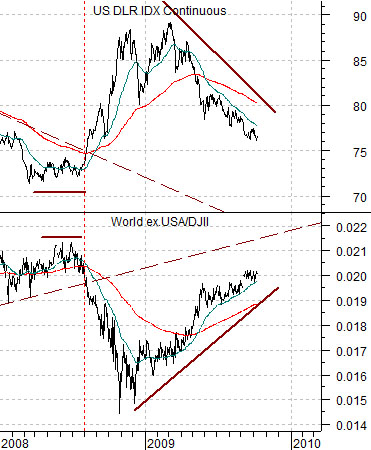
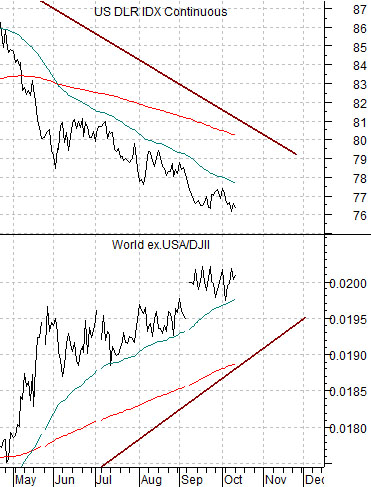
IF the crude oil/CRB Index ratio makes new highs and the dollar falls to new lows THEN the Morgan Stanley World ex-USA Index divided by the Dow Jones Industrial Index (DJII) ratio will make new lows.
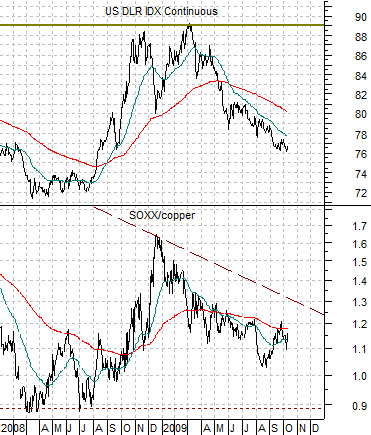
IF the dollar falls to new lows THEN the ratio between the Philadelphia Semiconductor Index (SOX) to copper futures prices will make new lows.
The point is a simple one even though we have undoubtedly made it appear almost impossibly complex. Last year the U.S. Dollar Index was struggling with the 72 level. Today it is grinding lower closer to 77. Last year the World ex.USA/DJII was ratio higher than it is at present. Last year the SOX/copper ratio was lower than it was at the end of trading yesterday. Last year crude oil prices were higher relative to general commodity prices than they are at present. In other words… for all intents and purposes… the markets have yet to show us in convincing fashion that we are wrong. On the other hand in the absence of actual dollar strength, an upside push by the SOX/copper ratio, or a clear bout of weakness in foreign stocks versus large cap U.S. stocks… it has yet to prove us right either.