We have what we believe is a very interesting chart-based point to make today but instead of simply jumping straight to it we are going to attempt to lay some sort of foundation first.
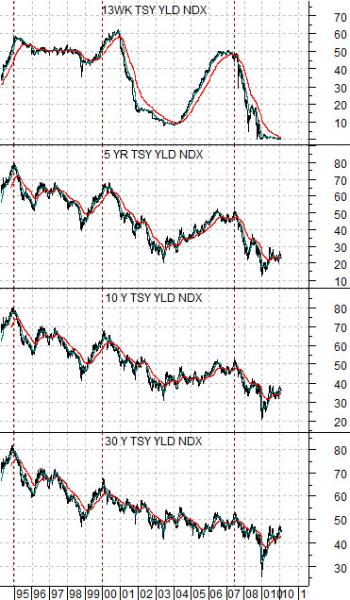
Below is a comparative view of 13-week (3-month) U.S. Treasury yields, 5-year Treasury yields, 10-year Treasury yields, and 30-year Treasury yields from 1994 to the present time period.
The first point is that in general yields tend to rise in fall in tandem. In other words while there are stretches of time when long-term and short-term yields move in opposite directions the basic paths tend to be similar.
Feb. 1 (Bloomberg) — For all the concern about budget deficits and the rising supply of debt, government bonds are the place to be so far in 2010, with returns topping equities and commodities by the most since February… Investors expected another losing year after bonds posted the worst returns in a decade in 2009 amid record debt sales to fund efforts to pull the global economy out of the recession. Instead, the securities were January’s winners on growing concern that the recovery will slow after China clamped down on borrowing, the Obama administration proposed limiting the size of banks and Greece’s finances roiled European markets.
Our argument today has almost nothing to do with the Bloomberg comments above but we did wish to at least point out that there are opposing forces acting on the bond markets. Economic recovery and soaring deficits apply downward pressure on prices while concerns with regard to China and Greece support prices.
At any given point in time investors are buying and selling bonds, extending or removing duration, switching between Treasuries and corporates, and reacting to efforts by central banks to tighten or loosen monetary stimulus. Bond prices move higher and lower in response to the reality or perception of economic growth.
Equity/Bond Markets
In the July/August 2006 publication of ‘Current Issues in Economics and Finance’ produced by the Federal Reserve Bank of New York we find the following observation:
Before each of the last six recessions, short-term interest rates rose above long-term rates, reversing the customary pattern and producing what economists call a yield curve inversion. Thus, it is not surprising that the recent flattening of the yield curve has attracted the attention of the media and financial markets and prompted speculation about the possibility of a new downturn.
The intriguing thing is that this was published in the summer of 2006- a full two years ahead of the peak for commodity prices and collapse of Bear Stearns and Lehman Bros. The two points that come to mind are as follows. First, yield curve inversions have the capacity to create recessions. Second, there is an apparent lag between significant changes in the shape or slope of the yield curve and its impact on financial asset prices.
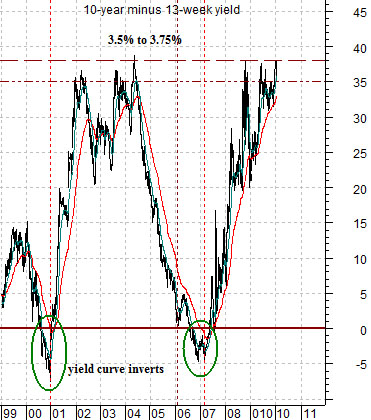
The New York Fed argued in this article that the while a yield curve can be constructed using the Fed funds rate, Eurodollars, swaps, and even corporates the best combination included the spread between 10-year and 3-month Treasury yields. For this reason we tend to focus on the yield spread or difference shown at top right when referring to the slope of the yield curve in our work.
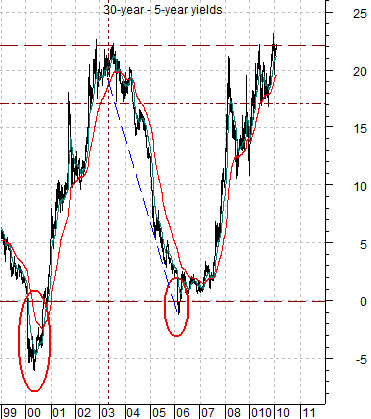
There is a second yield spread that we show from time to time based on the difference between 30-year and 5-year U.S. Treasury yields. We show this chart below right.
Above we showed that in general the trend for short and long-term Treasury yields tends to be fairly similar while noting that from time to time yields can and have diverged. The argument is that these divergences are often a result of robust changes in the slope of the yield curve.
The chart at top right shows that the yield spread moved below the ‘0’ line during the second half of 2000 and again through the second half of 2006. This means that during these two time frame the yield on 3-month TBills was higher than the yield on 10-year Treasuries- a situation that tends to precede economic slow downs and recessions.
Following both instances the spread quickly rebounded higher until 10-year yields were 3.5% to 3.75% greater than TBill yields. With the Fed holding the over night funds rate between 0% and .25% this has helped hold 10-year yields below 4.0%.
The 30-year minus 5-year spread is broadly similar except for one small detail. The spread declined below the ‘0’ during the first quarter of both 2000 and 2006 suggesting that it has a tendency to ‘lead’ at the turns by roughly six months.
We will continue on with the ‘meat’ of the argument on the next page. Our purpose here was to point out that yield curve inversions tend to precede recessions while showing that the spread between 30-year and 5-year Treasury yields is a reasonable surrogate for the yield curve. Of special note is the tendency for the 30- 5 spread to invert a couple of quarters ahead of the more traditional 10- 3-month spread.