We comment from time to time that it is seldom a good idea to argue with the bond market. By ‘bond market’ we are not referring to the decisions and actions of central bankers who are invariably late to the party. In fact we have suggested that there is often a lag of close to one year between trend changes for long-term yields and the inevitable readjustment of short-term policy.
In any event… our point is that while short and long-term yields often trend together- as one might intuitively expect- there are times when the two diverge and when this happens it usually makes sense to pay attention to what the long end of the bond market is saying.
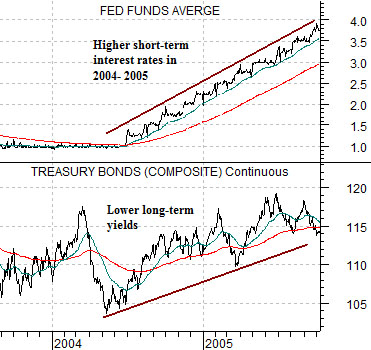
Below is a comparison between the Fed funds target rate and the U.S. 30-year T-Bond futures from 2003 through much of 2005. Keep in mind that the Fed funds rate reflects yield while the TBonds are shown in terms of price.
When the Fed began the process of tightening credit and lifting the funds rate in 2004 the bond market reacted by lowering long-term yields. In other words as short-term yields moved higher long-term yields began to decline as the bond market concluded that tighter credit would eventually lead to slower growth.
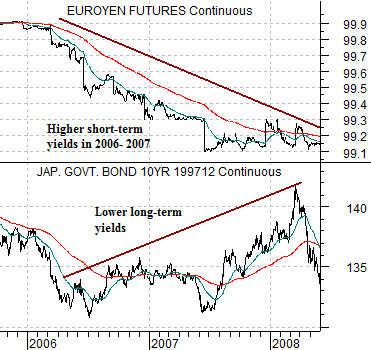
Next we have included a comparison between 3-month euroyen futures and the 10-year Japanese (JGB) bond futures. In this instance we are showing both short and long-term debt prices.
After a prolonged period of time holding short-term yields effectively at 0% the Bank of Japan allowed yields to rise in 2006. As euroyen futures prices declined from roughly 99.9 (reflecting a yield of .1%) the bond market sold off in price. After the initial decline, however, 10-year bond prices started to rise creating the same kind of divergence between higher short-term and lower long-term yields that had taken place in the U.S. markets a couple of years earlier.
The point? The Fed has recently stated that it intends to maintain or increase its monetary accommodation and intuitively one might expect that this should lead to even lower long-term yields. Yet… the two examples shown on this page suggest that if the bond market comes to the conclusion that the Fed is ‘too easy’ it is entirely possible that bond prices can turn lower at any time.
Equity/Bond Markets
Sept. 27 (Bloomberg) — This year’s rally in Treasuries has pushed yields so low that a Federal Reserve measure of risk shows U.S. government securities are too expensive.
The financial model created by economists at the central bank that includes expectations for interest rates, growth and inflation shows Treasuries are the most overvalued since the financial crisis in December 2008, just before 10-year note yields almost doubled in the following six months.
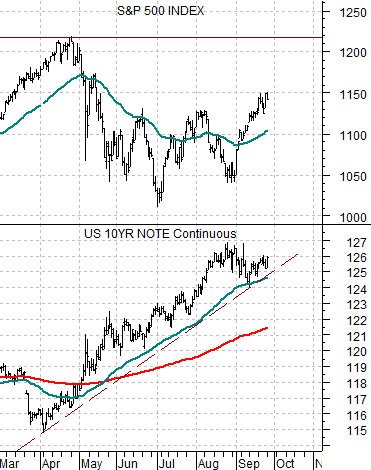
Below is a chart comparison between the S&P 500 Index (SPX) and the U.S. 10-year T-Note futures.
We are going to return to an argument that we initially introduced some months back. The idea was that while the equity market was declining as bond prices moved higher it may take ‘new highs’ for the SPX to actually break the rising trend for the bond market.
Now… ‘new highs’ is a somewhat fuzzy concept but given that the bond market is holding its rising trend even after the SPX pushed back above 1130 we may have to conclude that in this instance ‘new highs’ means something north of 1220.
The point is that the T-Note futures began to rise as the SPX pushed above the 1200 level back in April so if this index were to push to ‘new highs’ then it would be difficult to understand the logic behind owning long-term Treasuries at current yields.
So… one answer to the question of ‘when will the bond market turn lower in price?’ would be after the SPX pushes through 1220.
Another answer is based on ‘time’.
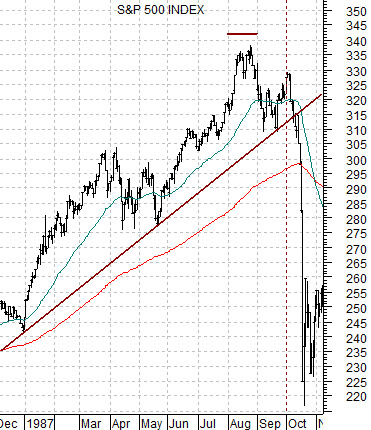
At bottom is a chart of the SPX from 1987. Our focus is on two points of time- late August and early October.
The SPX peaked in late August but managed to hold the rising trend until early in October. In other words even in the face of the kind of pressures that were building into a price ‘crash’ the trend refused to break until the third quarter had come to an end. The money that was chasing equities higher refused to leave the trend until the books were closed at the end of the third quarter.
We mention the 1987 comparison because the bond market this year made a price peak in late August- similar to the top for the stock market 23 years ago. We are not going to argue that bond prices are set to ‘crash’ but are instead suggesting that it may be difficult to alter the trend until the current quarter has come to a close.
If we put these two arguments together we end up with a rather bullish short-term equity markets stance. The prospect of some kind of bond price weakness next month combined with the idea that the SPX may have to reach ‘new highs’ in the interim suggests at least the potential for a very compressed stock market rally as the SPX ratchets up from around 1150 through 1220. Given that many are hoping for a seasonal sell off into the October earnings releases to add positions at lower prices and we end up with the kind of back drop that almost begs for the kind of rally that leaves the bears sitting on the sidelines only to be forced into the market at higher prices.