We are going to deal with trend changes associated with pivots for interest rates today. This is a topic that we always find rather intriguing.
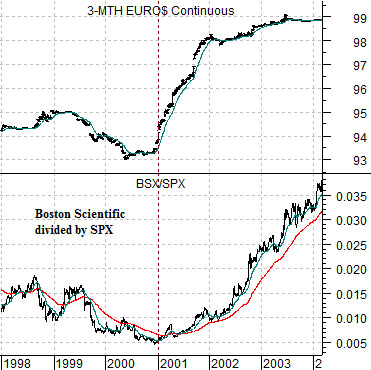
The chart below compares 3-month eurodollar futures prices with the ratio between Boston Scientific (BSX) and the S&P 500 Index (SPX) from 1998 into early 2004.
The argument is that there was a reason why the BSX/SPX ratio bottomed and turned higher around the end of 2000. In fact it is probably fair to write that there were two reasons. First, the sectors that had previously been driving the SPX higher started to weaken. Second, stocks and themes previously out of favor as cyclical strength pushed interest rates higher began to appear attractive as falling yields began to expand valuations.
The point is that when eurodollar prices began to rise at the end of 2000 denoting falling short-term interest rates the markets rotated over to new theme. BSX outperformed the broad market from 2001 into 2004 when surging energy prices turned the trend for yields upwards once again.
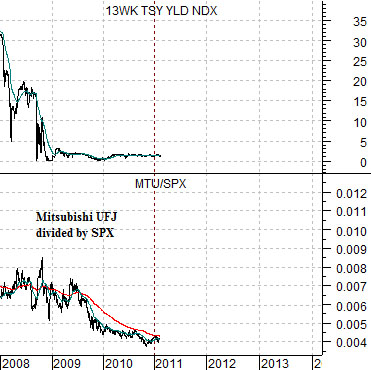
Below is a chart of 3-month Treasury yields and the ratio between Japanese bank Mitsubishi UFJ (MTU) to the SPX. Keep in mind that the top chart showed short-term debt prices while this chart is using short-term yields. In other words the situation today is almost the exact opposite to 2000 in that interest rates are rising instead of falling.
The bottom chart has been set up with a time frame equivalent to the top chart only 10 years later. The top chart starts at the beginning of 1998 while this chart runs from the beginning of 2008.
The picture that we are attempting to convey has something to do with the way relative strength has changed within the markets over the past quarter or so in response to an upturn for long-term U.S. yields and short-term Chinese yields. The decline in the MTU/SPX ratio from 2008 through 2010 appears somewhat similar to the trend for the BSX/SPX ratio between 1998 and late 2000.
The comparison suggests that the laggard banks (i.e. MTU) could continue to outperform the broad market as long as the trend for yields remains higher.

Equity/Bond Markets
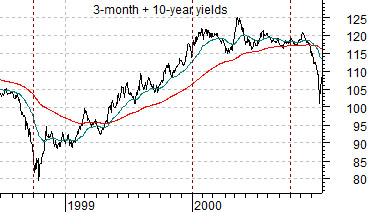
Below are two charts of the sum of 3-month and 10-year Treasury yields. The top chart is from mid-2010 to the present day while the lower chart starts in mid-1998.
The thought is that yields bottomed and turned higher in October of 1998 following the Asian crisis and in October of 2010 after the Eurozone crisis. What if… yields follow the same path into 2012 that did from late 1998 into 2000?
There are a few points in time to keep in mind. In June of 1999 the Fed raised the funds rate for the first time following the crisis. In January of 2000 long-term yields peaked with 30-year yields falling below the 200-day e.m.a. in March just ahead of the peak for the Nasdaq. In May of 2000 the Fed raise the funds rate for the final time with the initial rate cut coming in January of 2001.
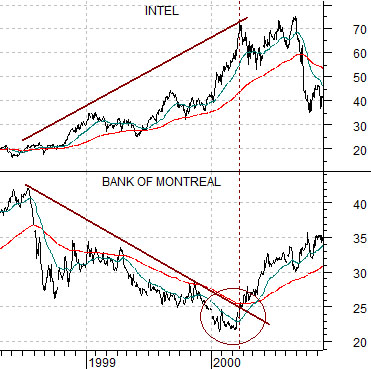
First… offsets. While the equity markets screamed higher along with yields through 1999 there were a number of non-cyclical or rate sensitive sectors that actually declined. We show an example of this below using a chart of Intel and Bank of Montreal.
Notice that Bank of Montreal trended lower until Intel stopped rising and, we will argue, the key to the peak for Intel had something to do with the break down for 30-year Treasury yields in March of 2000.
If the current situation is similar to 1999 then we have a wild year ahead of us. The problem is that as money moves towards cyclical strength in response to rising interest rates it tends to drain away from other sectors. In other words ‘offsets’ is all about winners and losers or, perhaps, where is the money going to and coming from.
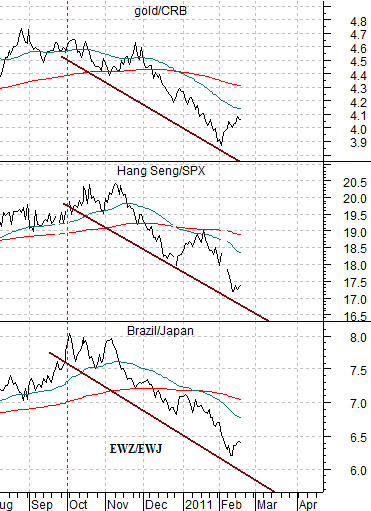
So… when yields turned higher last autumn… what sectors began to weaken on a relative basis? The chart below right suggests that some rather surprising names show up as early ‘losers’. Gold began to decline relative to the CRB Index, the Hang Seng Index from Hong Kong started to fall relative to the S&P 500 Index, and the Brazilian stock market weakened against the Japanese market.