We are going to take a few liberties with our chart comparisons today- hopefully for the greater good. Our topic has to do with the expected direction of the equity markets over the next few quarters.
When we refer to the ‘equity markets’ we are not writing about Chinese consumer products companies speculating in real estate, companies with suspect mining projects in hostile third world countries, or companies that change their names every decade in order to be associated with the latest investment fad. Instead we are writing about the kind of companies that populate the S&P 500 Index- large cap names with actual sales, earnings, and corporate histories.
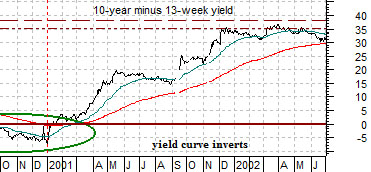
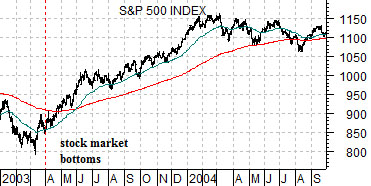
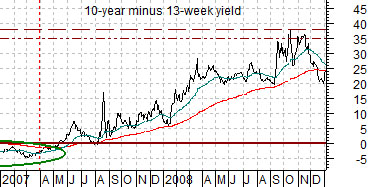
Below we show a chart of the S&P 500 Index (SPX) from the start of 2003 through September of 2004 and chart of the spread or difference between 10-year Treasury yields and 3-month Treasury yields from October of 2000 through June of 2002.
The argument- once again- is that a flat or inverted yield curve (i.e. a spread close to or below the ‘0’ line) acts to slow economic growth. The problem is that there is a considerable lag between dramatic changes in the slope of the yield curve and the impact on the equity markets.
Our thought is that the lag between the yield spread and its impact on the equity markets is close to 2 years. However to get the best ‘fit’ we have offset our first chart comparison by 1 year and 9 months. The point is that an inverted yield curve is the monetary equivalent of slamming down on the brakes while driving too fast down hill on an icy road. Your car will ultimately stop but not right away. A sharply sloped yield curve, on the other hand, serves to accelerate the spin of the tires but if the road is slippery enough and you are driving uphill it will take awhile before your tires gain much in the way of traction.
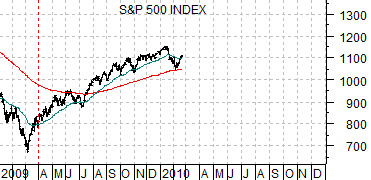
Below we show the SPX from the start of 2009 and the yield spread from the beginning of 2007. In this instance we have used our regular ‘lag’ of two years. The idea is that the yield curve’s inversion during 2006 and 2007 helped slow the economy to the point where a highly leveraged financial system tipped into crisis. On the other hand we are now working through the lagged impact of the rapid widening of the yield spread through 2008. If the markets can find even the slightest amount of traction the argument is that the trend for the SPX should remain positive for at least another quarter or two.
Equity/Bond Markets
In the intermediate-term the trend for the equity markets still look higher to us. In the short run, however, prices still look somewhat lower.
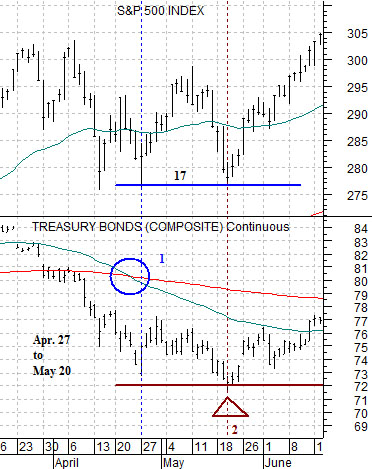
Below we return to the comparison between the SPX and the U.S. 30-year T-Bond futures from 1987.
We have argued that there were two ‘chart points’ in this comparison that were important. The first occurred just after the moving average lines for the TBonds ‘crossed’ to the down side. This set the lows for the SPX. The second took place 17 trading days later in May when the TBond futures finally reached a defensible low. In between April 27th and May 20th the SPX bottomed, rallied sharply, and then returned to the lows.
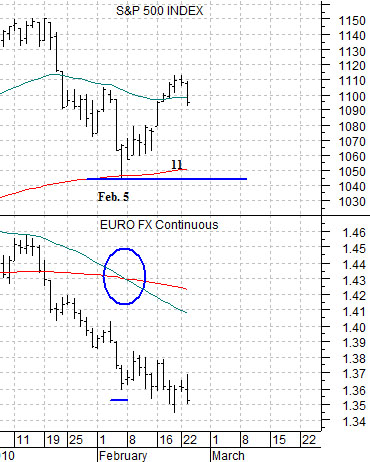
We used this example as a template for the current situation even as we substituted the euro for the bond market. The chart below right shows that the SPX bottomed on February 5th as the moving average lines for the euro ‘crossed’. The equity markets rallied- similar to 1987- and are now under pressure as the euro continues to grind lower.
Our thoughts are that the SPX will continue to work back towards 1050 until the euro finds a bottom and that, in a sense, you will know that the euro has reached a low (with the dollar at a high) when the equity markets begin to accelerate to the upside once again.
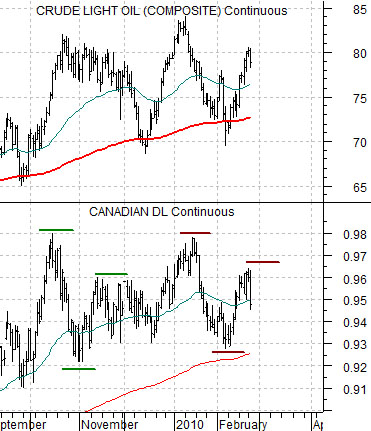
Last is a comparison between crude oil futures and the Canadian dollar (CAD) futures. Our expectation was that the CAD would rise back to around .9600 which would mark the rally highs for crude oil prices. If history were to repeat… the next low for the Cdn currency (which could mark the next high for the U.S. dollar) would be made once crude oil futures move back below the 200-day e.m.a. line (i.e. around 72). In recent months crude oil futures have only managed to trade below the m.a. line for a few days before the next rally has emerged.
