

I’m always amazed whenever I hear anyone talk about “growth in China” as if China is a smart investment for investors looking to diversify. Every time I hear this, my first thought is “don’t they have access to a chart?”
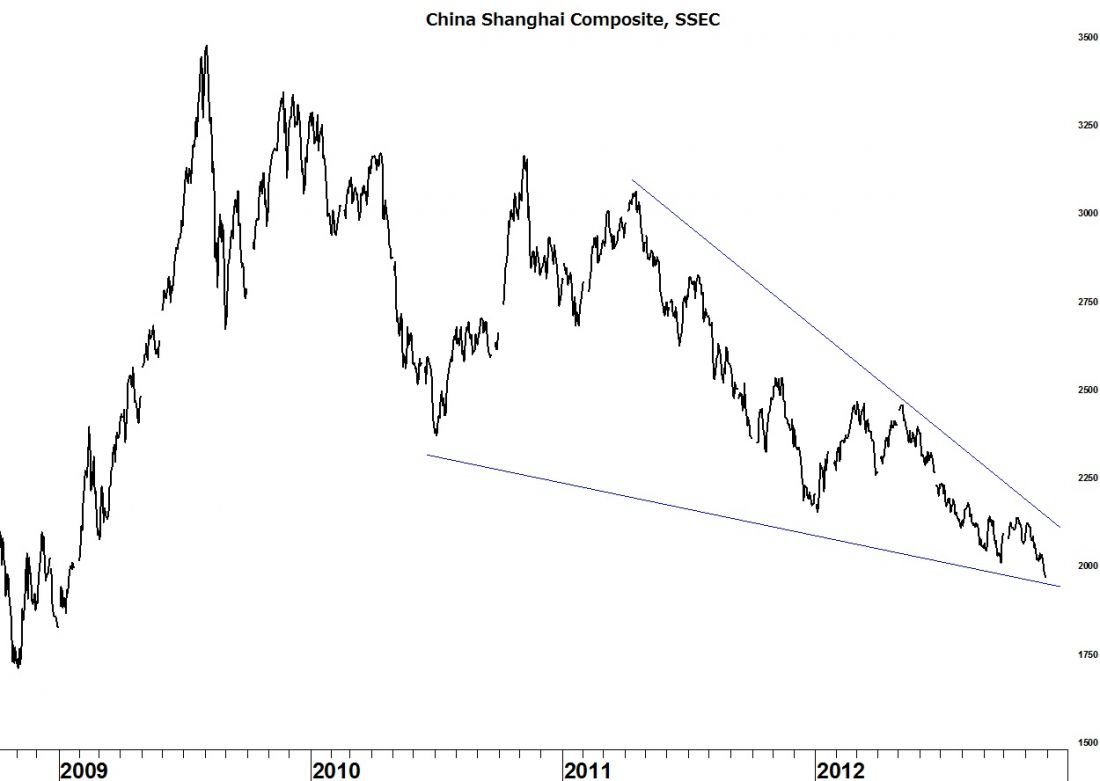
A quick look at a chart of the Shanghai Composite index (SSEC) reveals that it has been dropping since August 2009! Perhaps when they look at that chart, they see a bullish wedge; two converging trendlines as in the first chart below. Such a formation calls for a return to the top of the pattern once the upper trendline is broken. I suspect that, for most China investors during the last few years, SSEC has felt more like a “wedgie,” than a wedge. Perhaps they are calling for a bottom and expect the pattern to be triggered setting off a new bull market in Chinese equities.
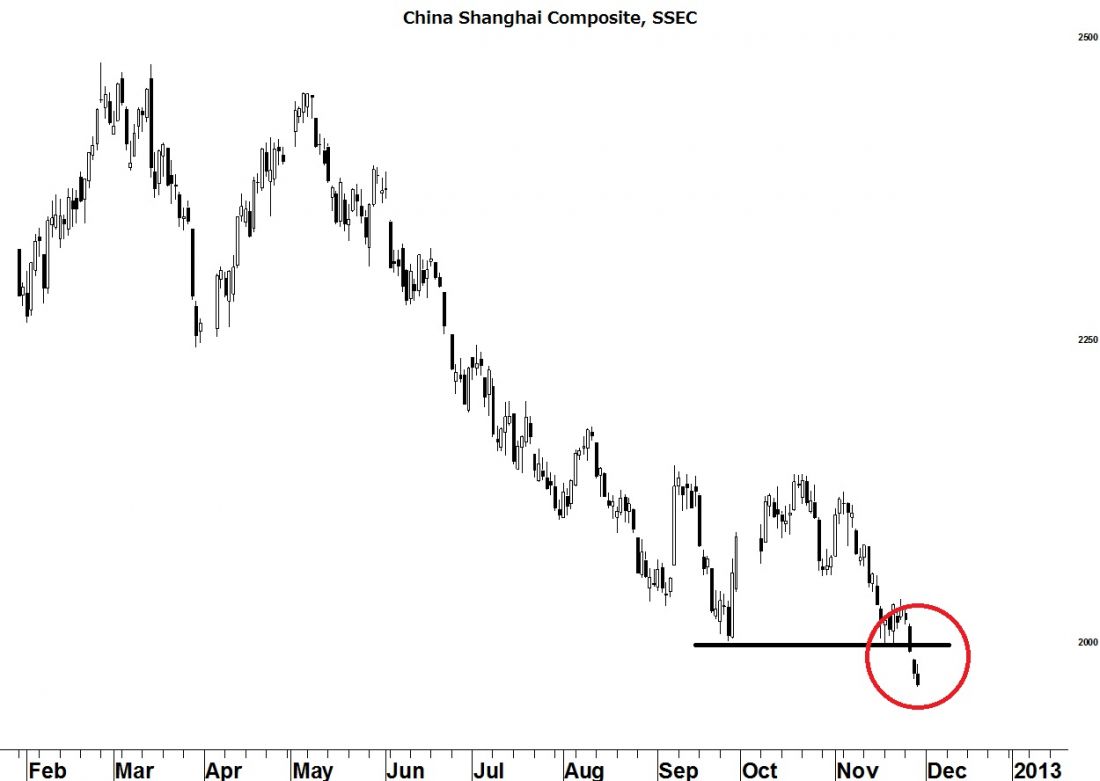
Drilling down to more recent history it looks to me as if the minor support level at 2,000 was breached just last week. This break implies a move to the October 2008 low near 1,665 because, whether we measure from the 2008 low or the low in 2005, all normally accepted Fibonacci retracements levels have been broken. That’s another 20% down in the already 3-year old bear market. For those who are still interested in Chinese equities, I’ve got a wall north of Beijing I could sell you…
I’ll be speaking at the Detroit, Ann Arbor, Kalamazoo, and Grand Rapids chapters of the CFA society this week. All are welcome. Links to details are at my website. http://www.seattletechnicaladvisors.com/detroitchicago.html

