

On the one hand…
Three weeks ago the Shanghai Composite (SSEC) broke out from a multi-year bullish wedge formation. Wedges imply a minimum move back to the start of the wedge which, in this case, would mean an advance to over 3,000 – a 36% rally! Whoo-hoo! A recent spike in volume, however, warns of a short-term top and the better play is to wait until a pullback has completed.
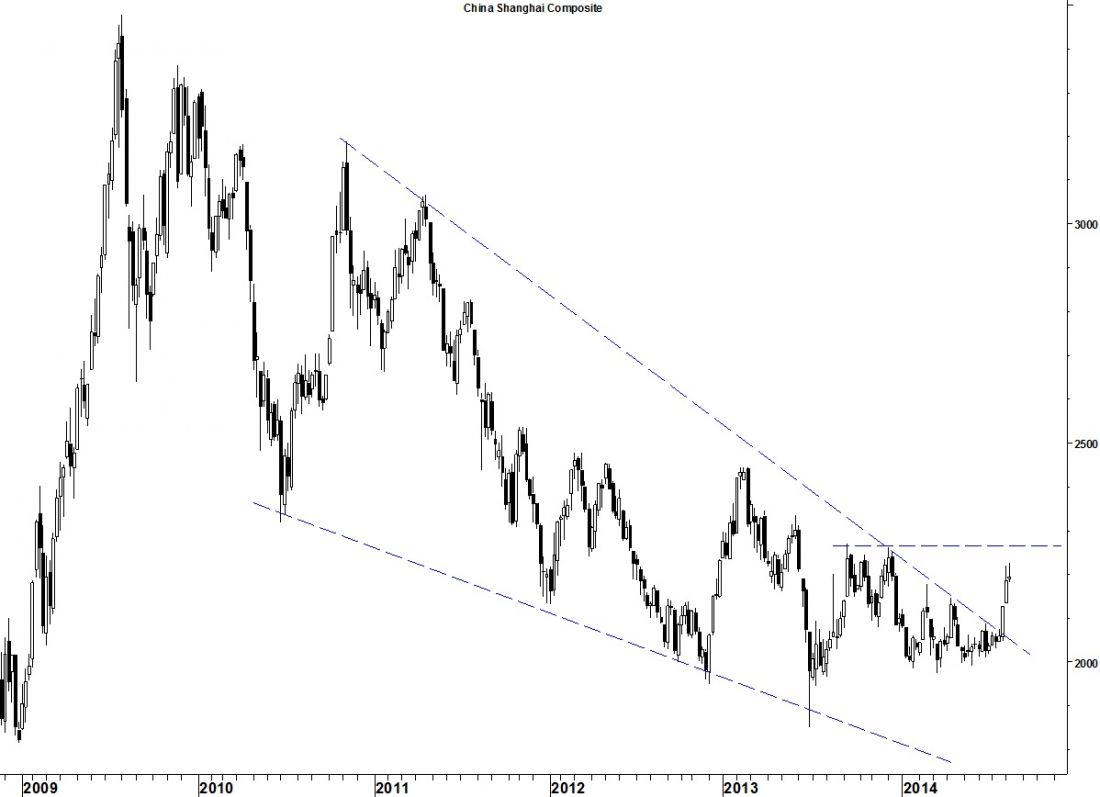
On the other hand…
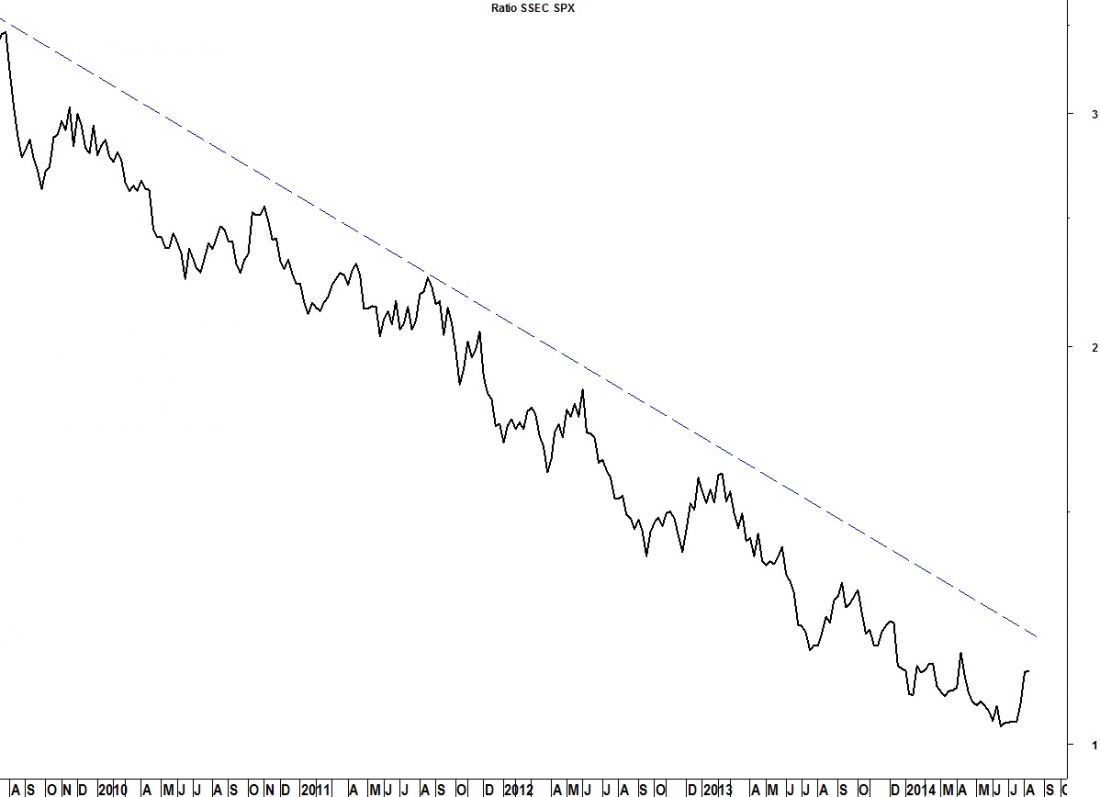
The old saying about a bull in a China shop alludes to the fact that things can get broken easily. That could include those who are bullish Chinese equities, too. I like to think that a breakout from horizontal resistance can be used to confirm a breakout like this. In the above chart that level is at 2,267. But the chart I’m going to be watching equally closely is the relative performance chart of SSEC versus the S&P 500 (figure 2). When this chart moves upward it means China is outperforming the US and vice versa. As the chart shows, SSEC has been underperforming the S&P for over five years. In addition to a breakout on the absolute price chart (above) I want to see relative performance break its long downtrend before getting long China.
= = =
Get your copy of the July Lindsay Report at SeattleTA.
Related Reading
Summer TraderPlanet Journal: Wondering What To Buy On A Stock Correction? Dividend Trend Analysis Points To IBM by IQ Trends Kelley Wright

