
Last week a dear friend asked me whether a close above the daily pivot, defined here as the prior day’s (High + Low + Close x 2)/4, was bullish or bearish for the next day’s trade. My off-the-cuff answer was “bearish”, to which he made a derisive remark that included the words “mean reverter”, among others.
Well, to settle that score, here is a ten-year study of cumulative next-day SPY performances when the closing price was above or below the pivot considering all long-short combinations:
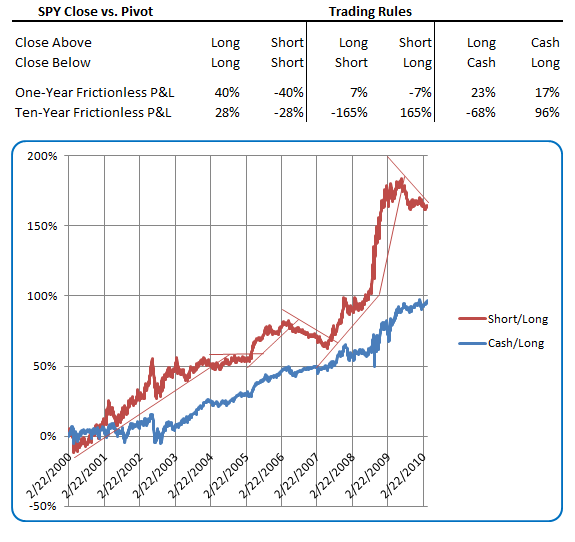
To my friend’s point, over the last year it has indeed been bullish to close above the pivot; however, over a longer time frame it has been quite the opposite.
All this goes to show, is that the conventional wisdom needs to be continuously reevaluated. By the same token, because certain behaviors often persist for extended periods once they begin to assert themselves, doing so may provide a tradable edge. Lastly, as fodder for further study, it’s easy to imagine how the slope of a rolling summation of wins or losses for this indicator may provide a more “timely” read of when the market is best suited to either a trending or mean reverting strategies.
[Related Post: Trading Equity Curves Like a Stock]

