First of all, in response to a customer’s question, the trades posted to the website are not cherry picked off of the COT Signals worksheet. The trades are being posted as examples of the mechanics that go into generating the trades on the worksheet.
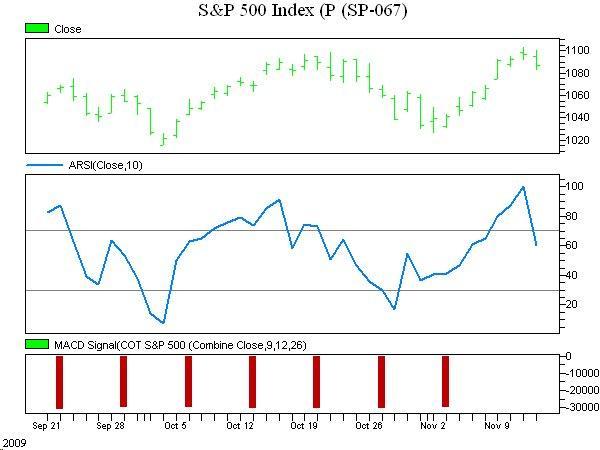
The S&P 500 tested 1100 this week and appears to have found considerable resistance. This makes sense since we have seen commercial selling increase on this attempted rally. Notice the increasing negative momentum of the commercial traders (red bar graph)
Thursday’s action triggered a sell signal in our COT Signals. This is the fourth signal generated this quarter with two out of the three previous trades being nice winners. This includes catching the 6% decline beginning October 21st.
Finally, as with any trading strategy, the risk can be quantified. The protective buy stop for this trade should be placed at Wednesday’s swing high of 1103.20. With the market currently trading at 1088 that means risking approximately $750 per e-mini S&P 500 contract.
Coincidentally, the COT Signals also triggered a short trade in the Dow for Friday’s trade, as well.
Please call with any questions.
866-990-0777