

During the sell off on Friday, copper was unable to dodge the sell orders, knocking it down almost 2.5%. The commodity has been under pressure over the past few weeks as traders digest the increase in concerns over China, a major end-user of copper, as well as the overall global weakness that can have a big impact on copper.
TECHNICAL ACTION
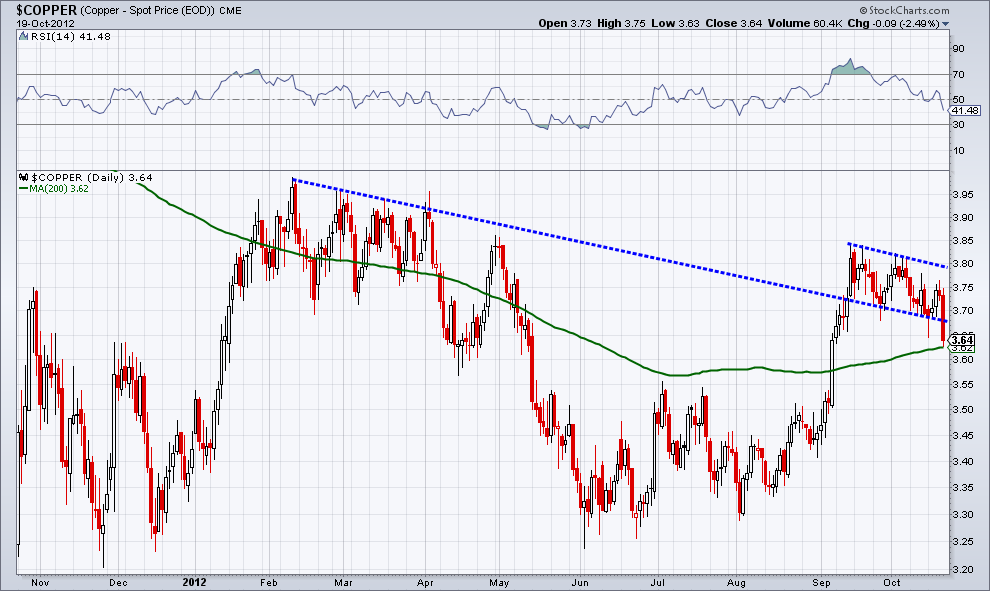
However, since late September, the trend line that began in February was able to provide a small layer of support to copper traders. Unfortunately, this support was broken with Friday’ weakness. On the downside we see the price action take us to the 200-day moving average which the bulls were able to hold, at least for one day.
SUPPORT BECOMES RESISTANCE
When we have a trend like break like we see in copper futures, the support becomes resistance if we see a short-term rally. That’s one of the great things about using trend lines, just because they are broken doesn’t mean they disappear and we should erase them from our charts. If traders are able to hold the 200-MA then we will likely see a test of the broken support. From there we have the previous line of resistance that currently sits at $3.80.
WATCH THE LEVELS
Copper bulls have a lot of work to do, but as traders it’s important to recognize the important levels on a chart and how they can change from support to resistance and vise versa.
Disclaimer: The information contained in this article should not be construed as investment advice, research, or an offer to buy or sell securities. Everything written here is meant for educational and entertainment purposes only. I or my affiliates may hold positions in securities mentioned.
= = =
Looking for specific trading ideas? Read our daily Markets section here.

