
By FXEmpire.com

Crude Oil Fundamental Analysis April 13, 2012, Forecast
Analysis and Recommendations:
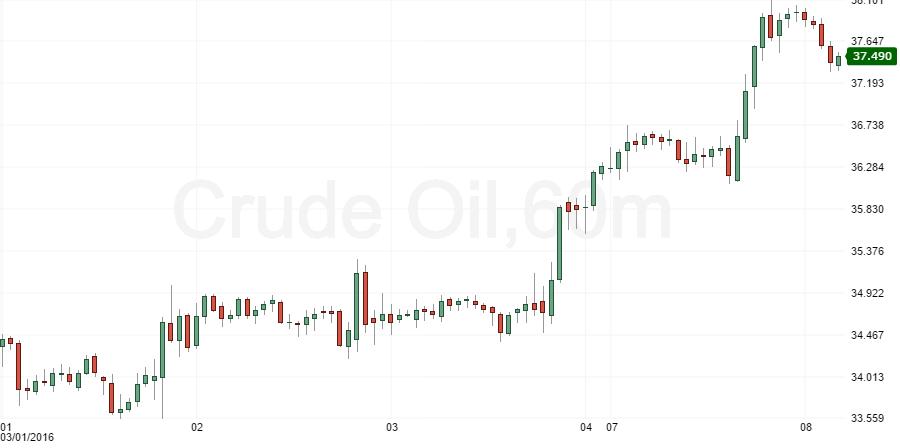
Crude Oil is trading at 103.59. Oil rose after the U.S. Energy Department said that fuel stockpiles declined and as a European Central Bank official signaled the lender may act to stem the spread of the region’s debt crisis.
The Organization of Petroleum Exporting Countries said in its monthly report that a perceived danger of a supply shortage related to Iran is the only thing keeping oil prices high at present. The organization said its collective output rose by 136,000 barrels a day in March to 31.3 million barrels a day, exceeding the world’s demand from the organization.
Separately, the International Energy Agency said that tightening oil market conditions appear to have eased.
The International Energy Agency said Thursday that 2012 global oil demand is expected to rise to 89.9 million barrels per day, a rise of 0.9% on 2011. The Paris-based IEA said 2012 oil consumption would reach a low in the second quarter at 86.6 million barrels per day on a “stuttering economic recovery,” but that demand would strengthen by the end of the year
Economic Reports April 12, 2012 actual v. forecast
|
AUD |
Employment Change |
44.0K |
6.0K |
-15.4K |
|
AUD |
Unemployment Rate |
5.2% |
5.3% |
5.2% |
|
EUR |
French CPI (MoM) |
0.8% |
0.6% |
0.4% |
|
INR |
Indian Industrial Production (YoY) |
4.1% |
6.6% |
1.1% |
|
SEK |
1.5% |
1.5% |
1.9% |
|
|
EUR |
Dutch Retail Sales (YoY) |
0.90% |
0.80% |
|
|
EUR |
ECB Monthly Report |
|||
|
GBP |
Trade Balance |
-8.8B |
-7.7B |
-7.9B |
|
EUR |
Industrial Production (MoM) |
0.5% |
-0.3% |
0.0% |
|
EUR |
Portuguese CPI (MoM) |
1.20% |
0.10% |
|
|
EUR |
Greek Unemployment Rate |
21.80% |
21.20% |
|
|
USD |
Core PPI (MoM) |
0.3% |
0.2% |
0.2% |
|
USD |
PPI (MoM) |
0.0% |
0.3% |
0.4% |
|
CAD |
Trade Balance |
0.3B |
2.0B |
2.0B |
|
USD |
Trade Balance |
-46.0B |
-52.0B |
-52.5B |
|
USD |
Initial Jobless Claims |
380K |
355K |
367K |
|
USD |
Continuing Jobless Claims |
3251K |
3335K |
3349K |
Economic Events for April 13, 2012
03:00 CNY Chinese Fixed Asset Investment 20.8% 21.5%
Chinese Fixed Asset Investment measures the change in the total spending on non-rural capital investments such as factories, roads, power grids, and property.
03:00 CNY Chinese GDP (YoY) 8.3% 8.9%
Gross Domestic Product (GDP) measures the annualized change in the inflation-adjusted value of all goods and services produced by the economy. It is the broadest measure of economic activity and the primary indicator of the economy’s health.
03:00 CNY Chinese Industrial Production 11.5% 11.4%
Industrial Production measures the change in the total inflation-adjusted value of output produced by manufacturers, mines, and utilities.
03:00 CNY Chinese Retail Sales (YoY) 15.0% 14.7%
Retail Sales measure the change in the total value of inflation-adjusted sales at the retail level. It is the foremost indicator of consumer spending, which accounts for the majority of overall economic activity.
07:00 EUR German CPI (MoM) 0.3% 0.3%
The German Consumer Price Index (CPI) measures the changes in the price of goods and services purchased by consumers.
07:00 EUR Finnish CPI (YoY) 3.10%
Consumer Price index is the most frequently used indicator of inflation and reflect changes in the cost of acquiring a fixed bask of goods and services by the average consumer. The weights are usually derived from household expenditure surveys. From 1995 the weight structure is based on the European National Accounting System Classification of Individual Consumption by Purpose (COICOP).The consumer price index (CPI) is a measure of change over a specified period of time in the general level of prices of goods and services that a given population acquires, uses or pays for consumption. It compares a household’s cost for a specific basket of finished goods and services with the cost of the same basket during an earlier benchmark period.
09:30 GBP PPI Input (MoM) 1.2% 2.1%
Producer Price Index (PPI) Input measures the change in the price of goods and raw materials purchased by manufacturers. The index is a leading indicator of consumer price inflation.
13:30 USD Core CPI (MoM) 0.2% 0.1%
13:30 USD CPI (MoM) 0.3% 0.4%
The Consumer Price Index (CPI) measures the change in the price of goods and services from the perspective of the consumer. It is a key way to measure changes in purchasing trends and inflation.
14:55 USD Michigan Consumer Sentiment 76.2 76.2
The University of Michigan Consumer Sentiment Index rates the relative level of current and future economic conditions. There are two versions of this data released two weeks apart, preliminary and revised. The preliminary data tends to have a greater impact. The reading is compiled from a survey of around 500 consumers.
18:00 USD Fed Chairman Bernanke Speaks
Federal Reserve Chairman Ben Bernanke (February 2006 – January 2014) is to speak. As head of the Fed, which controls short term interest rates, he has more influence over the U.S. dollar’s value than any other person. Traders closely watch his speeches as they are often used to drop hints regarding future monetary policy
Originally posted here

