
By FXEmpire.com

Crude Oil Fundamental Analysis April 17, 2012, Forecast
Analysis and Recommendations:
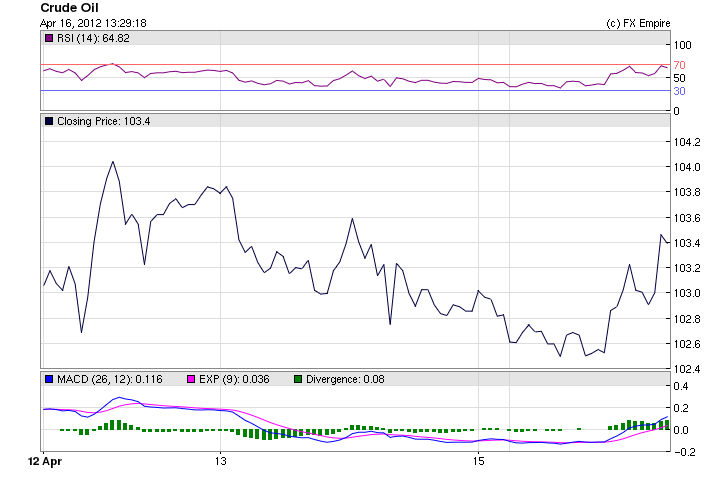
Crude Oil continued to drop today, though it remained pretty much within a tight channel, moving up in overseas action and then falling as the US markets opened. Oil is trading at 102.63
Iran and leading nations agreed to hold a second summit on Tehran’s nuclear program on May 23 in Baghdad.
Oil markets appear to have stabilized in recent days, thanks to a boost in output from Saudi Arabia and other crude producers, according to two new reports.
Assuming those trends continue and no unpleasant surprises emerge that could ease pressure on world oil prices and provide a boost to the U.S. economy in the coming months.
Last week a report from the International Energy Agency found that global oil supplies have become less constrained in the past few weeks, even as U.S. and E.U. sanctions on Iran are pushing that country’s crude off the market. A report from the U.S. Energy Department released Tuesday came to a similar conclusion: oil markets are loosening, even though sanctions are expected to cause a 15 percent drop in Iranian production this year.
Crude prices in New York ended at $102.83 per barrel Friday, capping oil’s fifth weekly decline since February. Oil futures dropped earlier in the day on reports of slowing growth in China, the world’s second-largest oil consumer.
Economic Events: (GMT)
WEEKLY
-
This Week in Petroleum
Release Schedule: Wednesday @ 1:00 p.m. EST (schedule) -
Gasoline and Diesel Fuel Update
Release Schedule: Monday between 4:00 and 5:00 p.m. EST (schedule) -
Weekly Petroleum Status Report
Release Schedule: The wpsrsummary.pdf, overview.pdf, and Tables 1-14 in CSV and XLS formats, are released to the Web site after 10:30 a.m. (Eastern Time) on Wednesday. All other PDF and HTML files are released to the Web site after 1:00 p.m. (Eastern Time) on Wednesday. Appendix D is produced during the winter heating season, which extends from October through March of each year. For some weeks which include holidays, releases are delayed by one day. (schedule)
Economic Reports for April 16, 2012 actual v. forecast
|
GBP |
Rightmove House Price Index (MoM) |
2.9% |
1.6% |
|
|
JPY |
BoJ Governor Shirakawa Speaks |
|||
|
CHF |
PPI (MoM) |
0.3% |
0.5% |
0.8% |
|
USD |
Core Retail Sales (MoM) |
0.8% |
0.6% |
0.9% |
|
Foreign Securities Purchases |
12.50B |
7.23B |
-4.28B |
|
|
USD |
Retail Sales (MoM) |
0.8% |
0.3% |
1.0% |
|
USD |
NY Empire State Manufacturing Index |
6.6 |
18.0 |
20.2 |
|
USD |
TIC Net Long-Term Transactions |
10.1B |
41.3B |
102.4B |
Economic Events scheduled for April 17, 2012 that affect the European and American Markets
09:30 GBP CPI (YoY) 3.4%
The Consumer Price Index (CPI) measures the change in the price of goods and services from the perspective of the consumer. It is a key way to measure changes in purchasing trends and inflation.
10:00 EUR CPI (YoY) 2.6% 2.6%
The Consumer Price Index (CPI) measures the change in the price of goods and services from the perspective of the consumer. It is a key way to measure changes in purchasing trends and inflation.
10:00 EUR German ZEW Economic Sentiment 19.0 22.3
The German Zentrum f?r Europ?ische Wirtschaftsforschung (ZEW) Economic Sentiment Index gauges the six-month economic outlook. A level above zero indicates optimism; below indicates pessimism. The reading is compiled from a survey of about 350 German institutional investors and analysts.
10:00 EUR Core CPI (YoY) 1.5%
The Core Consumer Price Index (CPI) measures the change in the price of goods and services purchased by consumers, excluding food, energy, alcohol, and tobacco. The data has a relatively mild impact because overall CPI is the European Central Bank’s mandated inflation target.
13:30 USD Building Permits 0.71M 0.71M
Building Permits measures the change in the number of new building permits issued by the government. Building permits are a key indicator of demand in the housing market.
13:30 USD Housing Starts 0.70M 0.70M
Housing starts measures the change in the annualized number of new residential buildings that began construction during the reported month. It is a leading indicator of strength in the housing sector.
14:15 USD Industrial Production (MoM) 0.5%
Industrial Production measures the change in the total inflation-adjusted value of output produced by manufacturers, mines, and utilities.
pain
Originally posted here

