
By FXEmpire.com

Crude Oil Fundamental Analysis April 2, 2012, Forecast
Analysis and Recommendations:
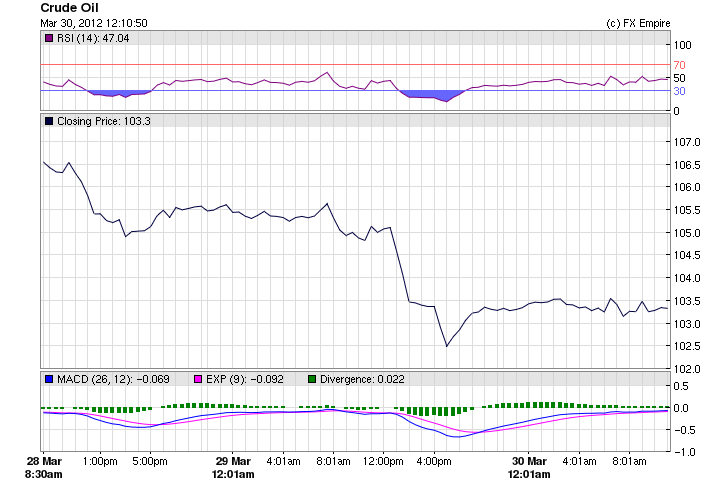
Crude Oil gained some of yesterday’s losses picking up .75/barrel to trade at 103.53.
US consumer spending increased along with consumer sentiment, which means Americans are driving and purchasing more, giving a bump to oil prices.
US lawmakers are again pushing to enforce tougher sanctions on Iran, as a meeting between Western Powers, OPEC leaders and Iranian officials is now scheduled for April 13th, at which time; it is hoping that tensions will decrease.
EU Finance Ministers reached agreements today in Copenhagen to increase funding to the EFSF and ESM to build a larger firewall. Spain introduced a tough new budget implementing difficult austerity measures in the hopes are reducing their deficit.
Crude fell over 2.00 yesterday, when French President Sarkozy, said that he was in discussions with US and UK officials as well as the IEA and was supportive of releasing strategic reserves to force down the price of oil.
Inflation in the 17-nation euro zone slowed to a 2.6% annual pace in March, down from 2.7% in February, the European Union statistical agency Eurostat released today, the increase is directly related to the price of oil and petroleum products.
Economic Events: (GMT)
WEEKLY
-
This Week in Petroleum
Release Schedule: Wednesday @ 1:00 p.m. EST (schedule) -
Gasoline and Diesel Fuel Update
Release Schedule: Monday between 4:00 and 5:00 p.m. EST (schedule) -
Weekly Petroleum Status Report
Release Schedule: The wpsrsummary.pdf, overview.pdf, and Tables 1-14 in CSV and XLS formats, are released to the Web site after 10:30 a.m. (Eastern Time) on Wednesday. All other PDF and HTML files are released to the Web site after 1:00 p.m. (Eastern Time) on Wednesday. Appendix D is produced during the winter heating season, which extends from October through March of each year. For some weeks which include holidays, releases are delayed by one day. (schedule)
Economic Reports March 30, 2012 actual v. forecast
|
JPY |
Unemployment Rate |
4.5% |
4.6% |
4.6% |
|
JPY |
Tokyo Core CPI (YoY) |
-0.3% |
-0.3% |
-0.3% |
|
JPY |
Industrial Production (MoM) |
1.9% |
1.4% |
1.9% |
|
AUD |
HIA New Home Sales (MoM) |
3.0% |
-7.3% |
|
|
EUR |
French Consumer Spending (MoM) |
3.0% |
0.2% |
-0.4% |
|
CHF |
KOF Leading Indicators |
0.08 |
0.08 |
-0.11 |
|
NOK |
Norwegian Retail Sales (MoM) |
1.00% |
-0.50% |
1.10% |
|
EUR |
CPI (YoY) |
2.6% |
2.5% |
2.7% |
|
EUR |
Greek Retail Sales (YoY) |
-10.30% |
-12.60% |
|
|
USD |
Core PCE Price Index (MoM) |
0.1% |
0.1% |
0.2% |
|
CAD |
GDP (MoM) |
0.1% |
0.1% |
0.5% |
|
USD |
Personal Spending (MoM) |
0.8% |
0.6% |
0.4% |
|
USD |
Chicago PMI |
62.2 |
63.1 |
64.0 |
|
USD |
Michigan Consumer Sentiment Index |
76.2 |
75.1 |
74.3 |
Economic Events for Monday, April 2, 2012 Europe and America
08:15 CHF Retail Sales (YoY)
Retail Sales measure the change in the total value of inflation-adjusted sales at the retail level. It is the foremost indicator of consumer spending, which accounts for the majority of overall economic activity.
08:30 CHF SVME PMI
08:50 EUR French Manufacturing PMI
08:55 EUR German Manufacturing PMI
09:00 EUR Manufacturing PMI
09:30 GBP Manufacturing PMI
Manufacturing Purchasing Managers Index (PMI) measures the activity level of purchasing managers in the manufacturing sector. A reading above 50 indicates expansion in the sector; a reading below 50 indicates contraction. Traders watch these surveys closely as purchasing managers usually have early access to data about their company’s performance, which can be a leading indicator of overall economic performance.
10:00 EUR Unemployment Rate
The Unemployment Rate measures the percentage of the total work force that is unemployed and actively seeking employment during the previous month. The data tends to have a muted impact as there are several earlier indicators related to labor conditions in the euro zone.
15:00 USD ISM Manufacturing Index
The Institute of Supply Management (ISM) Manufacturing Purchasing Managers Index (PMI) rates the relative level of business conditions including employment, production, new orders, prices, supplier deliveries, and inventories.
The data is compiled from a survey of approximately 400 purchasing managers in the manufacturing industry.
On the index, a level above 50.0 indicates industry expansion, below indicates contraction.
Originally posted here

