

We’ve recently been enjoying a good rally in the crude oil futures contract breaking above the $100 resistance level.
There seem to be many opinions from different investment houses that the price of this commodity should keep rising and moreover, making the price of this energy source much more expensive for all of us.
This is the moment when I turn to technical analysis to determine if the CL contract can continue climbing without any retracement or is there a pullback approaching.
ELLIOTT WAVES
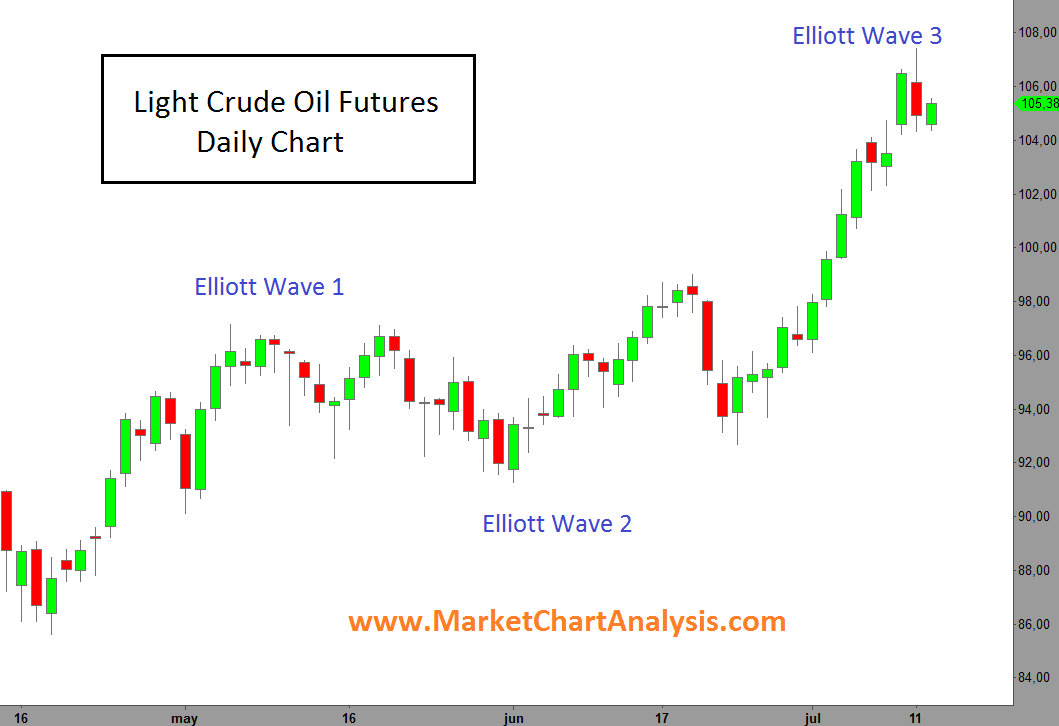
The daily chart is plotted from mid-April, which is when the Elliott Wave count turned positive. The first two waves were completed in a slightly disorganized manner but still valid for this model. The current wave 3 has proved to be the real big move that I mentioned earlier that pushed the price above the $100 mark.
In my opinion, it looks like the long wave 3 might be completing its move and we should look for an upcoming corrective wave 4. This pullback could test a range between $98 and$102. Should the retracement hold at that level, the next step would be a bull wave 5.
DIFFERENT APPROACH WITH WILLIAMS
This point of view goes along with the two new indicators available on the Vantage Point software: Williams Electronic Market Accumulation Index (EMAI) and Williams Professional Sentiment Index (PSI). These two new premium indicators have really impressed me as they seem to be telling us where the move is going slightly earlier than the rest of the traditional indicators that most often tend to lag the market action.
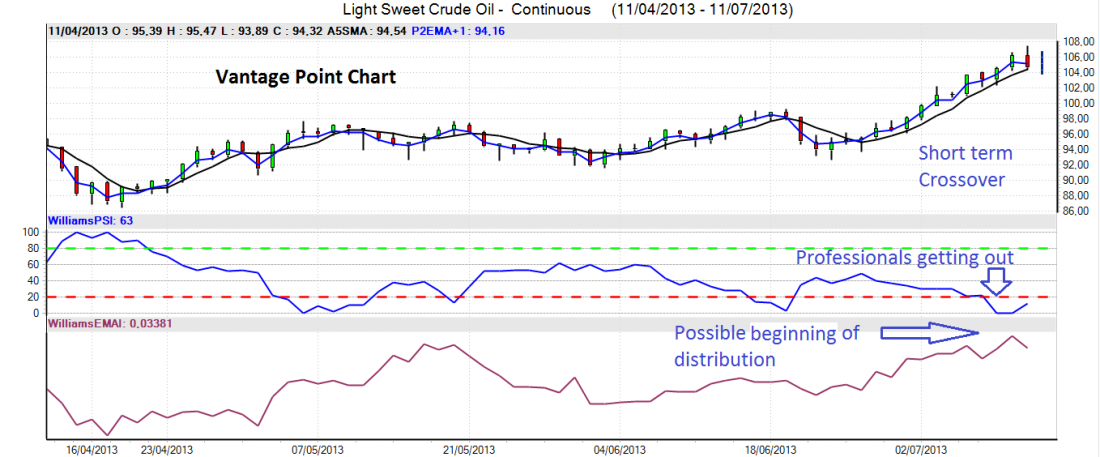
The PSI has slipped below the 20 point mark, indicating that the professional sentiment is looking for this pullback I mentioned earlier. Remember that this indicator doesn’t work like an oscillator implying an oversold status, but instead suggests going short in line with the bearish professional crowd once it slips below 20. The last time this happened (mid-June) the price of crude oil dropped around 7% in just a few trading sessions.
On the other side, we can also see how the EMAI is already hinting a possible end of accumulation and beginning of distribution, along with a possible upcoming negative crossover between the predicted short term crossover and the 5 day simple moving average.
BOTTOM LINE
Although the price of crude oil could continue pushing slightly higher, it won’t be long before we see a pullback in this market.
Once we see the retracement take place, we then have to establish possible entry levels to ride the next bull wave 5.
===

