Wednesday closed the day mixed on light volume. The Nasdaq Composite and the Dow were modestly red while the Nas 100 and S&P 500 were slightly green on the day. The highlight of the day was the Russell 2000 index that made new highs on the year. The narrow range day left another lackluster daily candle with a long upper shadow to make the bulls weary. Futures volume came in mixed today with the ES higher and the NQ along with the TF lighter on the day. The TRIN closed just off the highs at .98 and the VIX at 18.82. Gold closed up $6.10 to $1143.50 and oil up $1.19 to $80.87 a barrel.
Tuesday left possible reversal candles, Wednesday left another to watch for confirmation. The market still holds under 78.6% resistance and had the door open for two days to break out and move with market breadth charging higher today and again unable to advance. Buyers disappear and profit takers step in by afternoon with action like that. The MACD and RSI indicators on the daily charts for the indexes have flattened off and let the market sit sideways with no volatility to be found. Banks, Brokers, Hardware, Internets, and the SOX closed red, healthcare and telecom stayed green into the bell.
The resistance over the markets is becoming a brick wall, but any catalyst can gap us over this level like we saw on Monday. So don’t let the wall fool you, participation is still suspect and that should pick up the closer we get to the Job’s data. If it doesn’t I think that is a red flag for the bulls. Assuming Friday’s data comes in-line with what we saw off ADP the market should not be fearful and hold its ground.
Futures still have the key resistance overhead, the ES rejected 1125 after two tests. The C leg of the ABC pattern I mentioned last night is still intact and possibly setting up. Often with reversal patterns a retest of the high or a lower high is needed. The ES retested the NQ left a slightly lower high, the TF voided it by breaking out to new highs. However that isn’t unusual in that is will go with the overall market direction eventually after running around on its own. 38.2% on the ES is 1109.5, NQ 1831 and the TF 624.90 for support on any retracement. We did test the daily pivot and moved around it, but still no weekly pivot test.
Economic data for the week (underlined means more likely to be a mkt mover): Thursday 8:30 Unemployment Claims, 8:30 Revised Nonfarm Productivity, 8:30 Revised Unit Labor Costs, 10:00 Pending Home Sales, 10:00 Factory Orders, 10:30 Natural Gas Storage. Friday 8:30 NonFarm Employment Change, 8:30 Unemployment Rate, 8:30 Average Hourly Earnings. 3:00 Consumer Credit.
Some earnings for the week (keep in mind companies can change last minute: Thursday pre market ARIA, ATPG, BABY, OSTK, STP, URBN, WEN and after the bell COO, DDS, BOOM, IDSY, MRVL, SMTC, SPWRA. Friday pre market SOLF and after the bell LMIA.
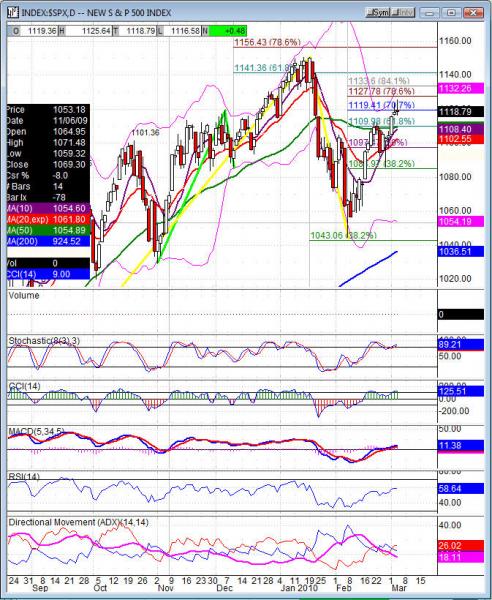
SPX (S&P 500) closed +.48 at 1118.79. Support: 1110.52, 1101.18, 1094.64 38.2%, 1075.50. Resistance: 1119.41, 1127.78 78.6%, 1150.45 1/19 swing high.