The week ended on new highs for 2009 across the broader indexes (COMPX,NDX, SPX, Dow, RUT). The week resulted in delivery a nice gain for the bulls ahead of the holidays and on very light volume. Which is not likely to see any improvement until January gets the new year started. The TRIN closed bullish at .66 and the VIX closed at 19.47 on new closing lows for the year. Gold closed up $10.80 to $1104.80 and oil up 73 cents to $77.40 a barrel.
Daily charts on COMPX, NDX, RUT, has the RSI at 69, stochastics at 95, 4 days of CCI divergence and into the upper Bollinger. The SPX and Dow has a lower RSI at 62, Stochastics 95, CCI flat at 149 and into the upper Bollinger. This past weeks advance has the market overbought, but that can continue. The ADX which I haven’t used a lot in the past year has moved down to 13-14 on each index. That is telling us the move coming will be large and is likely to hold onto the direction. So once the market breaks out that could hold, if we break down that could also hold for awhile. A pullback would be my preference here and keep the higher lows tone going, but that isn’t necessarily what we will see. Technically the market needs a pause or pullback to work off the overbought conditions and divergence on two indexes. However, a Santa Rally into year end is still on the minds of traders with last weeks four up days. The sentiment and trend is still positive on the market, which means until this market pulls back for a good entry shorter term trades will continue for us.
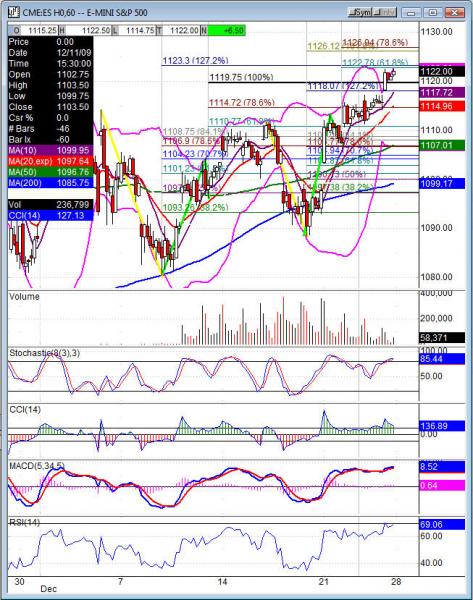
The week ahead will likely be similar to last weeks action. The market will be hit and miss for movement and have a few opportunities mixed in. Be patient and try to stay on the sidelines unless we have a good setup and risk well defined. The last week of the month and we’ll close out the year. December has a nice gain to hold onto but last week left a lot of open gaps with that gapping action all week. That is likely to see correction and close up the windows. Last week did not get even close to the weekly pivots, look for them to test early this week. ES is at 1113.75, NQ 1847 and TF 624.50.
Economic data for the week (underlined means more likely to be a mkt mover): Monday nothing due. Tuesday 9:00 S&P/CS Composite 20 HPI, 10:00 Consumer Confidence. Wednesday 9:45 Chicago PMI, 10:30 Crude Oil Inventories. Thursday 8:30 Unemployment Claims, 10:30 Natural Gas Storage. Friday US Markets are closed
Some earnings for the week (keep in mind companies can change last minute: Monday pre market NWPX and nothing after the bell. Tuesday nothing due out. Wednesday nothing pre market and after the bell OHB. Thursday pre market PNY and after the bell CRI. Friday nothing due out.
ES (S&P 500 e-mini) Monday’s pivot 1120.75, weekly pivot 1113.75. Intraday support: 1119.50, 1117.75, 1115.75 fills gap-1114.75, 1109.50-1107.50 fills gap, 1101.50, 1097.75 fills gap-1095.75 78.6%. Resistance: 1122.75-1123.50, 1127, 1132.25, 1135, 1147.50