Thursday closed 2009 out with a down day in a late day sell off. Volume was lower in the NYSE and Nasdaq, it just evaporated all week leading into the New Years holiday. It is normal to see that and we should see volume return into next week. The S&P 500 advanced 23.4%, Dow 18.8%, Russell 2000 25.2%,and the Nas Composite gained 43.9 % on the year for a very good year for the market. Pretty astonishing gains when we look back at the disastrous outlook for the economy and with financial institutions dropping like flies. Thursday the TRIN closed at 1.68 and the VIX at 21.68. Gold rallied $4.50 to $1097.00 an ounce and oil up 15 cents to $79.43 a barrel.
The week was a very narrow range, so technically not a lot happened in this market. The last hour drop on Thursday cleared up some gaps we had left open and retraced the light volume lift. The market still eked out gains for December and the past weeks losses left the market just off the 2009 highs. That is a pretty good spot to sit as we start January. There will be a lot of talk in the next week about “as January goes, so goes the year”. We saw 2009 plummet January –March and finally bottom to rally. Also the January Effect with small caps rallying in the first five days of January has lost its steam in the past few years. The small caps outperformed in December with a 7.9% gain, the SPX only up 1.8%, Dow up .8% and Nas composite 5.8%. Some trends don’t last forever is the point of that and don’t hang your hat on historical trends that we see losing steam year to year.
Daily charts has the Nas Composite and Nas 100– ADX at 19-21, RSI down to 62, CCI at 66-75, stochastics turning down and MACD trying to come down. S&P 500 and the Dow have stochastics turned down, CCI is 35-10, 52-54 RSI and ADX at 14 and the MACD turning down. Again last weeks volume was so light just about any pattern or indicator could easily be flipped around. We will step into next week with no bias. A bounce off the weakness that came in late day to retrace and then retest that low wouldn’t be out of the question early Monday. After that the week will start looking forward to the jobs data.
Economic data for the week (underlined means more likely to be a mkt mover): Monday 10:00 ISM Manufacturing PMI, 10:00 Construction Spending m/m, 10:00 ISM Manufacturing Prices. Tuesday 10:00 Pending Home Sales, 10:00 Factory Orders, All Day vehicle Sales. Wednesday 7:30 Challenger Job Cuts, 8:15 ADP Non Farm Employment Change, 10:00 ISM Non Manufacturing PMI, 10:30 Crude Oil Inventories, 2:00 FOMC Meeting Minutes. Thursday 8:30 Unemployment Claims. Friday 8:30 Non Farm Employment Change, 8:30 Unemployment Rate, 8:30 Average Hourly Earnings, 10:00 Wholesale Inventories, 3:00 Consumer Credit.
Some earnings for the week (keep in mind companies can change last minute: Monday nothing due out. Tuesday nothing pre market and after the bell MOS, SONC. Wednesday pre market FDO, MON, and after the bell BBBY, RT, SMSC. Thursday pre market STZ, LEN, SCHN, TXI and after the bell APOL, LWSN. Friday pre market PSMT and nothing after the bell.
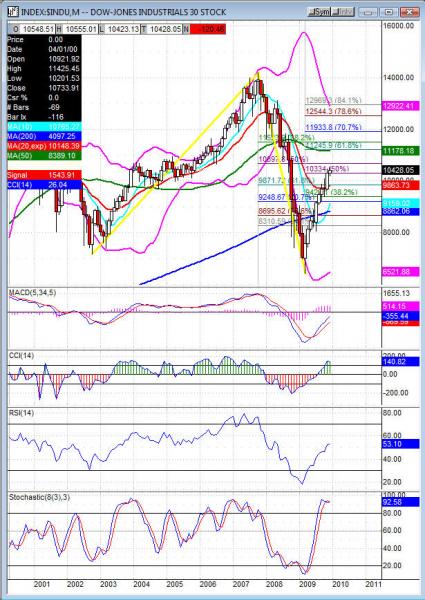
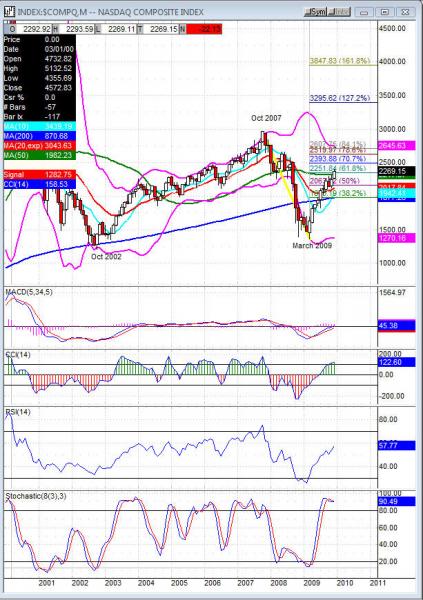
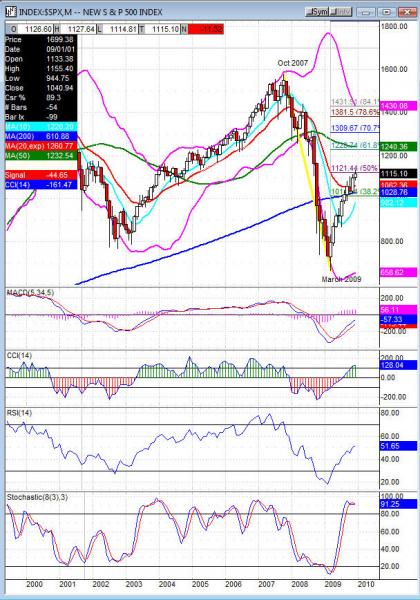
All the charts below are Monthly…not the normal daily
COMPX (Nasdaq Composite) closed -22.13 at 2269.15. Support: 2250.82, 2213.18 fills gap, 2178.05, 2173.09 50dma. Resistance: 2295.04, 2313.05, 2350.32, 2387.08.
SPX (S&P 500) closed -11.32 at 1115.10. Support: 1107.82, 1094.38 50dma-1091.80 38.2%, 1079.88, 1050.99 Resistance: 1121.44 50% on weekly – 1124.59, 1131.86, 1158.76, 1228.74 61.8% on weekly.
INDU (Dow) closed -120.46 at 10428.05. Support: 10423.10, 10385.90, 10333.10, 10265.79. Resistance: 10483.90, 10520.70, 10546.90, 10580.33 2009 highs-10593.20, 10668.50