Friday left the market with a split close, the Nasdaq Composite and S&P 500 closed slightly red on the day. The Nas 100 and the Dow closed marginally green on the day. All the broader markets showed a gain on the week and closed very near the highs for the week. The weeks range was not huge and resulted in a lot of light volume small steps up throughout the week. The TRIN closed bearish at .154 and the VIX at 17.58. Gold closed down $1.20 to $1107.00 and crude fell 84 cents to $81.27 a barrel.
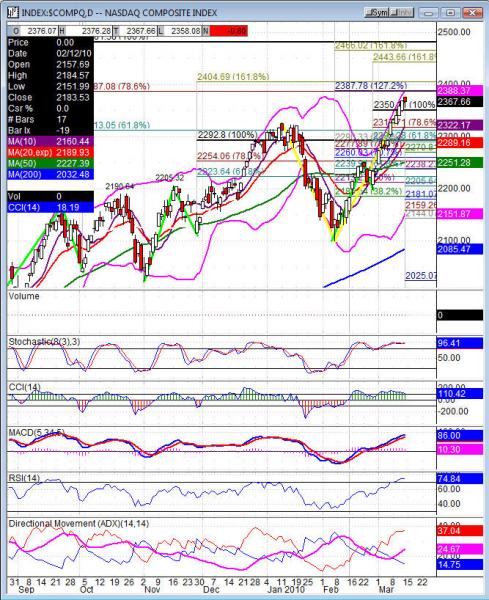
The Nasdaq Composite and Nasdaq 100 daily charts left a hanging man candle, Stochastics lines are together sitting flat, RSI turned dwon to 75 and the CCI is 110 just over 100 line support. The SPX tipped a new closing high on the year, but could still double top with that January high. The Stochastics sit flat at 95, CCI at 109, RSI 70, and the daily candlestick left indecision with the spinning top. The Dow left a spinning top on the day, still below the January highs by about 100 points. Stochastics sit flat at 92, CCI at 111 and the RSI at 66. The COMPX, NDX and SPX weekly charts are all piercing into the upper Bollinger band, the Dow is still below.
Daily charts don’t tell us a lot, every lift in this market hasn’t come from anything orderly, it is just a market on the run. The market continues to look stuck and ready to pullback and never gets the job done. Futures did not test the weekly pivot for the third time in four weeks. That along with disappearing volatility and volume has left us sitting a lot of the time. The week ahead will likely not be the same action and with a FOMC meeting we have some possibility of volatility really increasing. Financial reform bill from Senator Dodd is supposed to be out this week, that also could provide a lot of opportunity. Next week is also quadruple witching week.
Futures should trade down to the weekly pivots Monday. They aren’t far off Friday’s close because of the narrow range last week it won’t make for a lot of challenge. I do think we’ll see those level as a ledge in the market and a rotational point. ES 1141.75, NQ 1910.75 and TF 670.90 are the weekly levels. The ES and NQ that would also be under Friday’s low, that would likely provide the market with an orderly pullback and then some digestion.
Economic data for the week (underlined means more likely to be a mkt mover): Monday 8:30 Empire State Manufacturing Index, 9:00 TIC Long Term Purchases, 9:15 Capacity Utilization Rate, 9:15 Industrial Production, 1:00 NAHB Housing Market Index. Tuesday 8:30 Building Permits, 8:30 Housing Starts, 8:30 Import Prices, 2:15 FOMC Statement, 2:15 Federal Funds Rate. Wednesday 8:30 PPI, 8:30 Core PPI, 10:30 Crude Oil Inventories. Thursday 8:30 Core CPI, 8:30 Unemployment Claims, 8:30 CPI, 8:30 Current Account, 9:30 FOMC Member Hoenig Speaks, 10:00 Philly Fed Manufacturing Index, 10:00 CB Leading, 10:30 Natural Gas Storage, 12:30 FOMC Member Duke Speaks. Friday nothing due out
Some earnings for the week (keep in mind companies can change last minute: Monday pre market BPZ, OSTK and after the bell ESC, SQNM. Tuesday pre market ARIA, DSW, and after the bell DFS, SGK. Wednesday pre market GIS, SMTS and after bell MLHR, HIS, NKE. Thursday pre market BKS, FDX, GME, LDK, ROST, WGO and after the bell COMS, PALM. Friday pre market PERY and nothing after the bell.
COMPX (Nasdaq Composite) closed -.80 at 2367.66. Support: 2337.07, 2308.46, 2270.81 38.2%, 2251.28 50dma, 2205.64. Resistance: 2387.78, 2393.88, 2473.20 8/18 swing high, 2519.97