Monday closed the day higher with very light volume. The volume left a lot to be desired, but should pick up as the week progresses. Monday’s after three day weekends can often be a little light and we are still getting April underway. The broader markets left new closing highs on the year, the Dow came within 12 points of the 11, 000. The TRIN closed bullish at .62, the entire day was flat and range bound on the TRIN. The VIX closed at 17.02 on the low of day, still on the 10dma. Gold moved higher to $1133.40 up $7.30 and oil moved up $1.75 to close at $86.62 a barrel.
These light volume advances have become the norm with this lift and a year ago I would have been suspect of it holding up. The last 24 trading days have only seen 4 accumulation days, leaving volume as a missing component more often than not. Certainly not something we would have seen hold up but we are in that melt up mode. Divergence, overbought, light volume and even bad news hasn’t knocked the market off the bull road. Leaving us to not put so much on volume to help determine strength of the move…for now! That doesn’t mean I believe we can continue to melt up on light volume, but it does mean volume alone will help us to find a top.
The first two hours were impulsive to the upside and put in the range for the day. The remainder of the day chopped sideways and could leave us with a bull flag. The 65 minute charts on NDX, COMPX, SPX, Dow are all the same pattern and have 93 stochastics that are flat and plenty of room on the RSI and CCI to move out of the flag. We are on the upper bollingers, but that is normal with so much chop it comes to us. The daily charts the upper Bollinger is very close on the Dow, Nasdaq indexes and the SPX is there already. RSI is 71-74 on each, we get over 80 overbought conditions are going to be a bigger problem.
Futures did not test the weekly or daily pivots on Monday. The gap and go day didn’t let us drop into them. The ES over 1187.25 and into 1195 is still possible if we come out of the bull flag we left on the intraday (60 minute) chart. The NQ 1982.25 would be resistance to watch for and onto 1994. A drop under 1173.25 would push the Es much lower into 1162.25 weekly pivot and 78.6% fib support. The NQ 1984.25 support is key any lower and we look for 1948.75-1948 (weekly pivot) to get a test.
Economic data for the week (underlined means more likely to be a mkt mover): Tuesday 2:00 FOMC Meeting Minutes. Wednesday 10:30 Crude Oil Inventories, 3:00 Consumer Credit. Thursday 8:30 Unemployment Claims, 10:30 Natural Gas Storage. Friday 10:00 Wholesale Inventories
Some earnings for the week (keep in mind companies can change last minute: Tuesday nothing due out. Wednesday pre market FDO, MON and after the bell BBBY, LWSN, PBY, SCHN, WDFC. Thursday pre market ISCA, PIR and after the bell SMSC, NCTY. Friday pre market BTH, STZ and nothing after the bell.
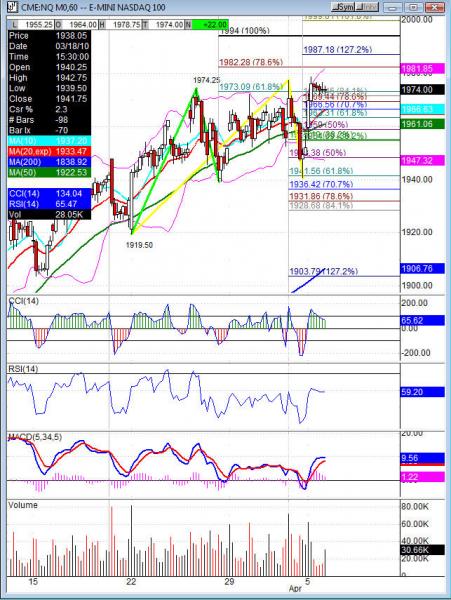
NQ (Nas 100 e-mini) Tuesday’s pivot 1969.50, weekly pivot 1948. Support: 1964.25, 1959.75, 1955.25, 1952 fills gap-1951.75, 1948.75 Resistance: 1977.25, 1982.25, 1987.25, 1994, 2000