Monday kicked off the week with a green day and volume was higher than Friday, keep in mind Friday was not a full day, so we aren’t comparing apples to apples. However, having said that volume was still better than last weeks showing some improvement. The Dow gained 800 points, SPX 59, NDX 101 and the Nas Composite 100 points on the month, not bad for a month that was teetering on a drop for half the month. The TRIN closed at 1.02 just over the line to tip the bears hat and the VIX finished the day at 24.51. Gold closed up $7.43 to $1181.63 an ounce and oil closed up $1.07 to $77.12.
Some strength in financials with a lagging weight around our feet from tech left the narrow range inside day ready for a move to come. The Nas Composite, Nas 100 and S&P 500 all sit just over the 50dma, leaving that as good support below us. Resistance levels using the high off October 28, 2007 to the lows of March 8, 2009 (it is best to put up weekly timeframe to see this swing) the Nas Composite has sat under 2251.85 61.8% retracement since September 13th crossing of 50%. Nas 100 crossed 50% at the end of August but still just hitting its head on 1781.28 61.8%. S&P 500 moved over 38.2% in August but still sits under 50% 1121.44 retracement. The Dow moved over 38.2% August 16th and just over 50% at 10334 by 10 points today, I would like to see the Dow at 10495. These resistance levels are like the wall of worry for the market and as we move into December will be key to finish the year strong.
Into Tuesday there is no early data but we have plenty at 10. I will be watching for a quiet night session and for a market ready to move after the first half hour. The range was so narrow on Monday we can bracket that range and look for a break of either side. The daily pivot on Monday was 1088.5 on the ES and the weekly is 1089.5, we saw those levels plenty today. NQ was also very close to each other at 1760 and 1761.25, TF daily was 575.60 and weekly 577.80. Leaving the weekly with plenty of action in the first day of the week, we can look for those still to be pivotal levels of support. A drop into 1089.5-1087.5 for the ES should be carefully watched, we drop there I will look for 1079.25. The NQ drops 1754.50 we can look for 1750.50 to get a look. The TF 569.50 support then 567.10 as minor support with 562.90 as a bigger level. Overhead the resistance levels are: TF over 585.90 to 591.60 gap fill, NQ 1777.75 onto 1793.75 and the ES 1098.75 and onto 1109 levels.
Economic data for the week (underlined means more likely to be a mkt mover): Tuesday 10:00 ISM Manufacturing PMI, 10:00 Pending Home Sales, 10:00 Construction Spending, 10:00 ISM Manufacturing Prices, All day vehicle sales. Wednesday 7:30 Challenger Job Cuts, 8:15 ADP Non Farm Employment Change, 10:30 Crude Oil Inventories, 12:30 FOMC Member Lacker Speaks, 2:00 Beige Book. Thursday 8:30 Unemployment Claims, 8:30 Revised NonFarm Productivity, 8:30 Revised Unit Labor Costs, 10:00 Fed Chairman Bernanke Testifies, 10:00 ISM NonManufacturing PMI, 10:30 Natural Gas Storage. Friday 8:30 NonFarm Employment Change, 8:30 Unemployment Rate, 8:30 Average Hourly Earnings, 10:00 Factory Orders.
Some earnings for the week (keep in mind companies can change last minute: Tuesday pre market ISLE, SPLS and after the bell SNDA. Wednesday pre market PTRY and after the bell SEAC, SIGM, SNPS. Thursday pre market DLM, TOL and after the bell MRVL, NOVL, ULTA. Friday pre market BIG and after the bell FMCN.
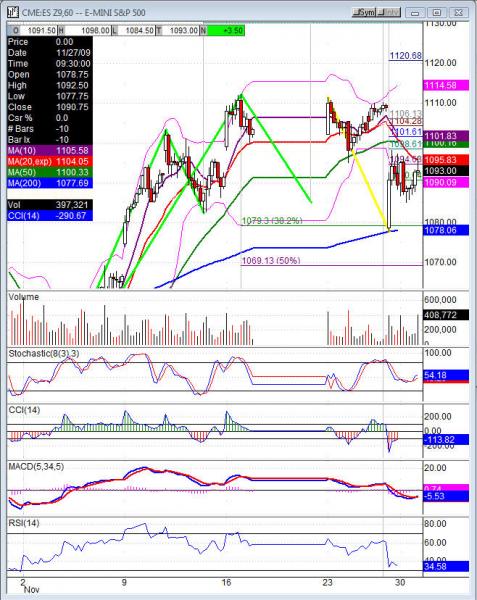
ES (S&P 500 e-mini) Tuesday’s pivot 1091.50, weekly pivot 1089.50. Intraday support: 1090.75, 1087.50, 1085.55, 1082, 1079.25 38.2%, 1074.50, 1069.25, 1066.50. Resistance: 1098.75, 1103.50-1104.25, 1109 fills gap, 1110.5-1112.25 11/16 swing high, 1116, 1120.75, 1124, 1129.50