Friday split the close with the Nasdaq 100 and Nasdaq Composite green and the S&P 500 and Dow closed red. The week closed up after four losing weeks, however the win was modest and an inside week. Leaving us with a very narrow range and now we will go into a shortened week. The volume was higher on Friday for an accumulation day on the Nas and distribution on the SPX and Dow. The NYSE volume was huge, a lot of which was due to the Berkshire B shares add to the S&P 500 index brought in huge levels of participation. The VIX closed at 22.73 and the TRIN bearish at 1.45. Gold closed down $5.90 to $1088.80 and oil down $12.4 to $74.04 on the day.
The indexes are sitting just below key resistance. Nas Composite 2186.54 with the 50dma at 2227.39, Nas 100 1783.41-1818.50 50dma, SPX 1084.97-1108.72 50dma, Dow 10176.90 and Russell 200 617.43 50dma. Those resistance levels along with the CCI just at 0 line resistance, stochastics are turned up, MACD lines are coming up, RSI moving up, leaving only the moving averages to turn and see the shorter term 10dma and 20dema get into bullish order. Aside from the moving averages the doors are opening slowly for the bulls, but now the resistance we sit into will have to open both doors to get this upside any continuation.
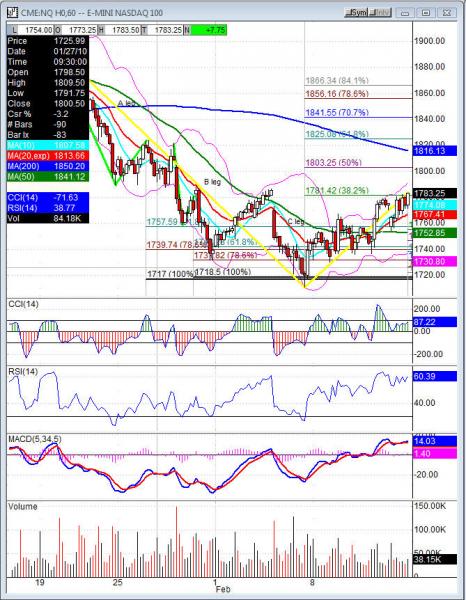
The NQ (Nasdaq 100 futures) closed right into the swing high from 2/3, that is very similar on many of the cash indexes too. This is key off that ABC pattern we started watching for early last week. We’ve held the lows and came off slowly and now over the prior swing high to turn the trend with some power is what we need to see. The market is taking baby steps so far and with Friday’s close up on the highs, that provided for a strong finish also right into the key 1783.5 38.2% on the weekly NQ chart. Futures high level close and the resistance over us is likely to need a pullback. Rejection of these resistance points would be very bearish leaving this week to make some decisions for us. The weekly pivot is below Friday’s close and that would be a healthy pullback off the lift and let the pullback buyers get in the market.
This week along with being shortened is also option expiration week for February options. Historical trends have meant very little in the past year but I like to point out what has happened in the past regardless of those trends being hit and miss. Tuesday has been bullish and the rest of the week bearish in February expiration week.
Economic data for the week (underlined means more likely to be a mkt mover): Monday US Markets are closed. Tuesday 8:30 Empire State Manufacturing Index, 9:00 TIC Long Term Purchases, 12:00 FOMC Member Hoenig Speaks, 1:00 NAHB Housing Market Index. Wednesday 8:30 Building Permits, 8:30 Housing Starts, 8:30 Import Prices, 9:15 Capacity Utilization Rate, 9:15 Industrial Production, 2:00 FOMC Meeting Minutes. Thursday 8:30 PPI, 8:30 Unemployment Claims, 8:30 Core PPI, 10:00 Philly Fed Manufacturing Index, 10:00 CB Leading Index, 10:30 Natural Gas Storage, 11:00 Crude Oil Inventories, 6:00 pm FOMC Member Duke Speaks. Friday 8:00 FOMC Member Dudley Speaks, 8:30 Core CPI, 8:30 CPI
Some earnings for the week (keep in mind companies can change last minute: Monday US Markets closed. Tuesday pre market ANF, KFT, MRK, Q, TEVA, and after the bell LZB, PACR, VCLK, WFMI, WINN. Wednesday pre market DE, DVN, ENZN, GENZ, MSO, NICE, PFCB, XTO and after the bell AEM, ADI, AMAT, CECO, CHK, FARO, HPQ, LVS, NTAP, NVDA, PCLN. Thursday pre market APA, GT, ITWO, INCY, MGM, POOL, PDE, TRA, TTC, WMT, and after the bell DELL, FSLR, INTU, JCOM, WMGI. Friday pre market JCP, PCG, SHPGY and nothing after the bell.
NQ (Nas 100 e-mini) Tuesday’s pivot 1773.75, weekly pivot 1765.75. Support: 1755.75, 1747, 1738.50, 1732, 1726.25, 1722.50, 1718.50-1717, 1710.75, 1707, 1702.25. Resistance: 1783.50 38.2% (daily)-1785.50 fills gap-1786.50 swing high, 1803.25-1805.50, 1809 fills gap, 1816.75 50dma, 1821.50, 1825