Friday left the market red across the broader markets and the losses resulted in a red close for the week. Volume was the best since December 18th on the NYSE and Nasdaq, that was expiration in December and prior to the holidays. The TRIN closed at 2.06, the last time the TRIN closed over 2 was December 17th. The VIX closed at 17.91, still having trouble getting over the 10dma. Gold closed down $12.00 to $1131 and oil down $1.44 to $77.95.
Weekly chart the Nasdaq Composite and Nas 100 engulfed the prior week and left us with a possible bearish pattern to watch. The RSI turned down, Stochastics are crossing down, the MACD is flat and the CCI turned down on both indexes weekly chart. The S&P 500 has a flatter CCI at 144, RSI turned down, stochastics have turned down and the MACD is flat. The Dow weekly left a gravestone doji and turned stochastics down, a flat RSI and MACD, CCI is hugging the 100 line support. Each of these weekly charts indicate a possible reversal or short term top. A confirmation week would be needed, that confirmation would come with a lower close. This is a time when shorts maybe covering, longs taking profits and just a tired market. The flat market breadth we experienced last week and the discrepancy Thursday in the TRIN to breadth gave us a red flag for Friday’s drop. Now the drop has left the week red and on the edge of a deeper pullback. Now if we come in next week to buying and take out the weeks highs, the game changes back to long is the right side. Take out the lows with conviction and see volume continue to be as heavy as Friday’s distribution day points us lower.
Into Tuesday we will be coming off a long weekend, which usually starts slow and picks up as the day progresses. Friday’s late day bounce helped to work off the short term oversold conditions we had off the early drop. Which leaves the market still poised for some downside. The ES watch 1135 resistance, NQ 1868.75 and TF 637. Back over those levels the market is very likely to see higher ground and take back some of the losses. Every drop the market has seen has been bought. So don’t forget the trend is still intact and that is UP. Support to look for a test is TF 628.30, ES 1124.5 and NQ 1849, below those levels we look for a much deeper drop.
Economic data for the week (underlined means more likely to be a mkt mover): Monday US Markets are closed. Tuesday 9:00 TIC Long Term Purchases, 1:00 NAHB Housing Market Index. Wednesday 8:30 Building Permits, 8:30 PPI, 8:30 Core PPI, 8:30 Housing Starts. Thursday 8:30 Unemployment Claims, 10:00 Philly Fed Manufacturing Index, 10:00 Leading Index, 10:30 Natural Gas Storage, 11:00 Crude Oil Inventories. Friday nothing due out.
Some earnings for the week (keep in mind companies can change last minute: Monday US Markets closed. Tuesday pre market C, LMT, EDU, PETS, AMTD and after the bell IBM, PNFP. Wednesday pre market BAC, BK, EAT, COH, MS, STT, USB, WFC and after the bell EBAY, FFIV, NVEC, SBUX, XLNX. Thursday pre market SCHW, CAL, FITB, GS, KEY, LM, LUV, UNH, XRX, ZOLL and after the bell AMD, AXP, COF, GOOG, IGT, MSCC, SYNA. Friday pre market GE, KMB, MBFI, MCD, SLB, STI.
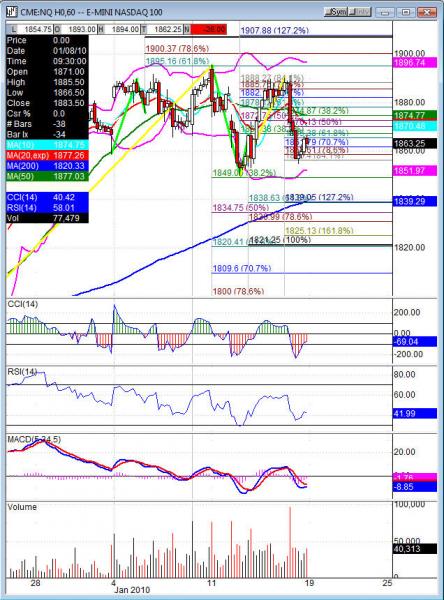
NQ (Nas 100 e-mini) Tuesday’s pivot 1869.75, weekly pivot 1871. Support: 1858.50, 1854.75, 1849 38.2%, 1844, 1839, 1834.75, 1831 Resistance: 1868.75, 1873, 1877.50, 1880.50, 1883.50, 1891.25, 1895.50