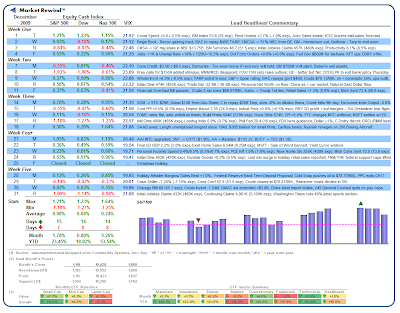
 Short of a sovereign debt downgrade or two, last month provided remarkably steady sleighing as the majority of economic reports continued to come in ahead of expectation. For the month, all tracked indices finished higher with the S&P 500, Dow Jones Industrials and NASDAQ 100 cash indices up by +1.78% , +0.80% and +5.26%, respectively. Supporting the smooth ride was a VIX well contained in the low twenties.
That left annual cash (and dividend inclusive) results showing very respectable gains of +23.45% (+26.34%) , +18.82% (+22.15%) and +53.54% (+54.72%), respectively. You may wish to compare these reading with a histogram of past annual results found here (see second chart — I’ll update that soon!). A sector-by-sector view is highlighted below:
As shown, Technology (XLK) and Materials (XLB) took the lead. Going into the new year, traders will soon be focused on the Fourth Quarter Earnings Season, now just around the corner.
Sentiment: Positive
Volatility: Very Low (VIX 20-25)
Direction: Positive
 [Click to Enlarge/ Weekly ETF Analyses/ Prior Monthly Summaries]
The Style-Box was calculated using the following PowerShares™ ETFs: Small-Growth (PWT), Small-Value (PWY), Mid-Growth (PWJ), Mid-Value (PWP), Large-Growth (PWB), and Large-Value (PWV). The Sector-Ribbon was calculated using the following Select Sector SPDR™ ETFs: Materials (XLB), Industrials (XLI), Energy (XLE), Staples (XLP), Discretionary (XLY), Financials (XLF), Technology (XLK), and Healthcare (XLV). The Standard & Poors 500, Dow Jones Industrial Average and NASDAQ 100 may be traded through ETF proxies, including the SPY or IVV, DIA and QQQQ, respectively.


