There’s a new Superbowl superstition making the rounds; if the NFL team wins, the market will be up this year; if the AFL wins, the market will be down.
Or maybe it’s the other way around. It really doesn’t matter, because this little gem of market wisdom is worth about the same as the rest of them … and you know what we think that is.
The market may be cracking now
This market may be cracking. There’s lots of evidence that the long bull is getting tired, and nervous investors are looking over their shoulders to see if the big bad bear is gaining on them.
Maybe it is. The broader equity market, as measured by the S&P 500, had its worst month since the middle of 2012 in January, and February may be worse. It is historically the second-worst month for stocks, with an average net return of -0.58%. Only August is worse.
The developing crash in emerging markets – and their currencies – is especial worrisome. World financial markets have plunged before on less.
And we are close to testing important technical support levels in both the S&P index and the equity futures. The way the market reacts to those technical levels this week will show us what the future direction is likely to be.
Specific technical levels to watch
The SPX made a high at 1850.65 on Jan 1, 2014, and has been down ever since. What the market gave in December, it took away in January. All of it.
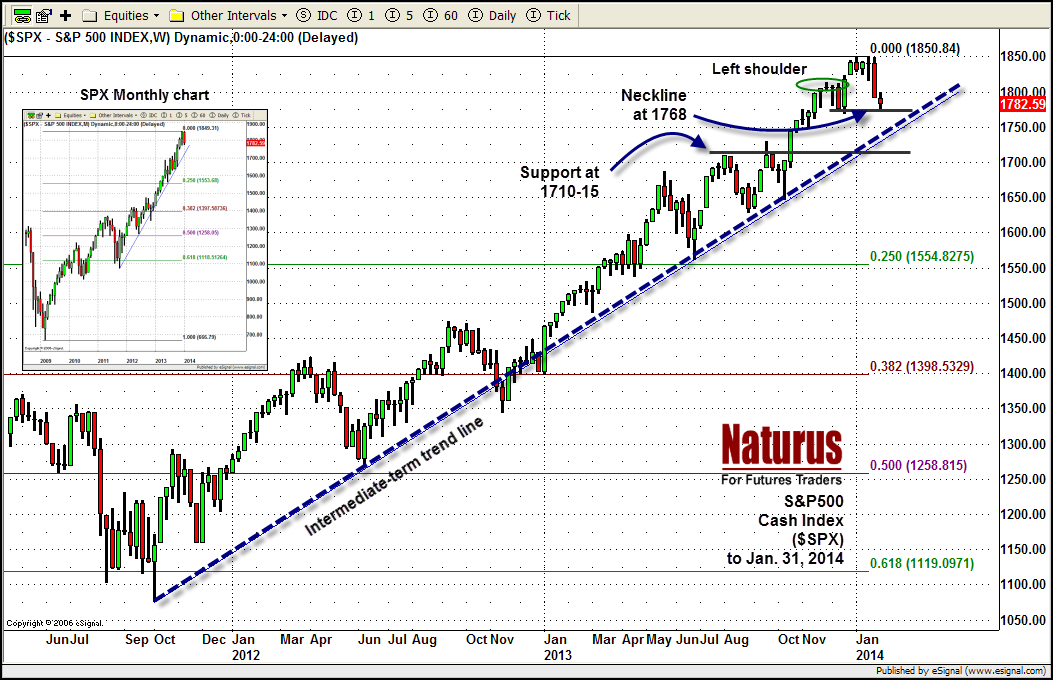
Now the battleground will be the December low around 1768. The SPX (the symbol for the S&P 500 Cash Index) came within a couple of points of that level in the Globex session last week.
It may well test it again this week, and if that low – which is also the neckline of a developing head-and-shoulders pattern – breaks down, the next stop is the long-term support around 1750.
And if the 1750 support fails, look out below! The next support is 1710-15, and then 1670-80. Below that we start to find the major retracement levels of the long rally from the 2009 low at 667 to the New Year’s High at 1850: a pullback to the 23% Fibonacci level would put us at 1580. Ouch.
Here’s a chart to make it clearer:
SPX Cash Index – Weekly – to Jan. 31, 2014


