When using the models and methods of George Lindsay our analysis starts with the very big picture and we slowly narrow down the forecast using a variety of his models. In this week’s column I want to examine a method Lindsay used to, not only start the forecast for a bull market top (what he referred to as, the ‘moment of truth’), but to determine the significance of the decline to follow.
DOING THE COUNT
To find the top of a bull market Lindsay used what he called a 15-year interval. This long-term interval is counted from an important low to an important high. The high is expected to occur somewhere between 15-years and 15-years, 11-months after the important low; most commonly 15-years, 2-months – 4months.
But what is an important low? For that we need the 22-year overlay.
SPACING MATTERS
Lindsay explained that to correctly identify the origin of a 15-year interval, we need to find a low which is correctly spaced between two other lows; a 22-year low and an eight-year low. In addition to the 15-year interval being roughly 15-years prior to a market top, the 22 and eight-year intervals are located likewise.
THE CHART
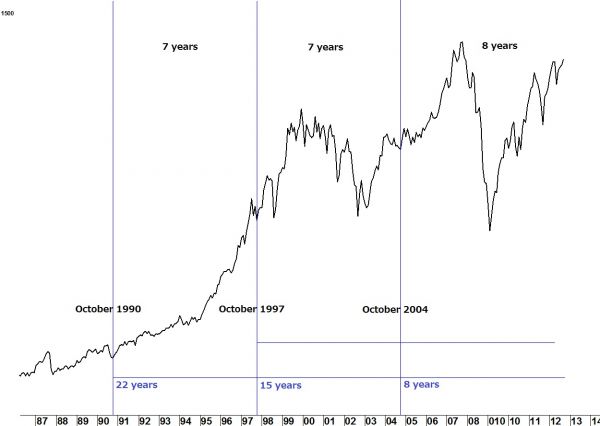
In the long term chart of the Dow Jones Industrial Average (below) one can see how the low in October 1990 is seven years prior to the low in October 1997. It, in turn is seven years prior to the eight-year low in October 2004. The lows, typically, are not so exact as to be in the same month as in this example. When the lows fall on important lows, rather than secondary lows, the overlay forecasts an important top during the time range forecast of the 15-year interval (15-years to 15-years, 11-months later).
WHAT DOES IT ALL MEAN?
The chart below tells us to expect a bull market top in a time range starting in October of this year.
Learn more about George Lindsay and his analytical methods here.