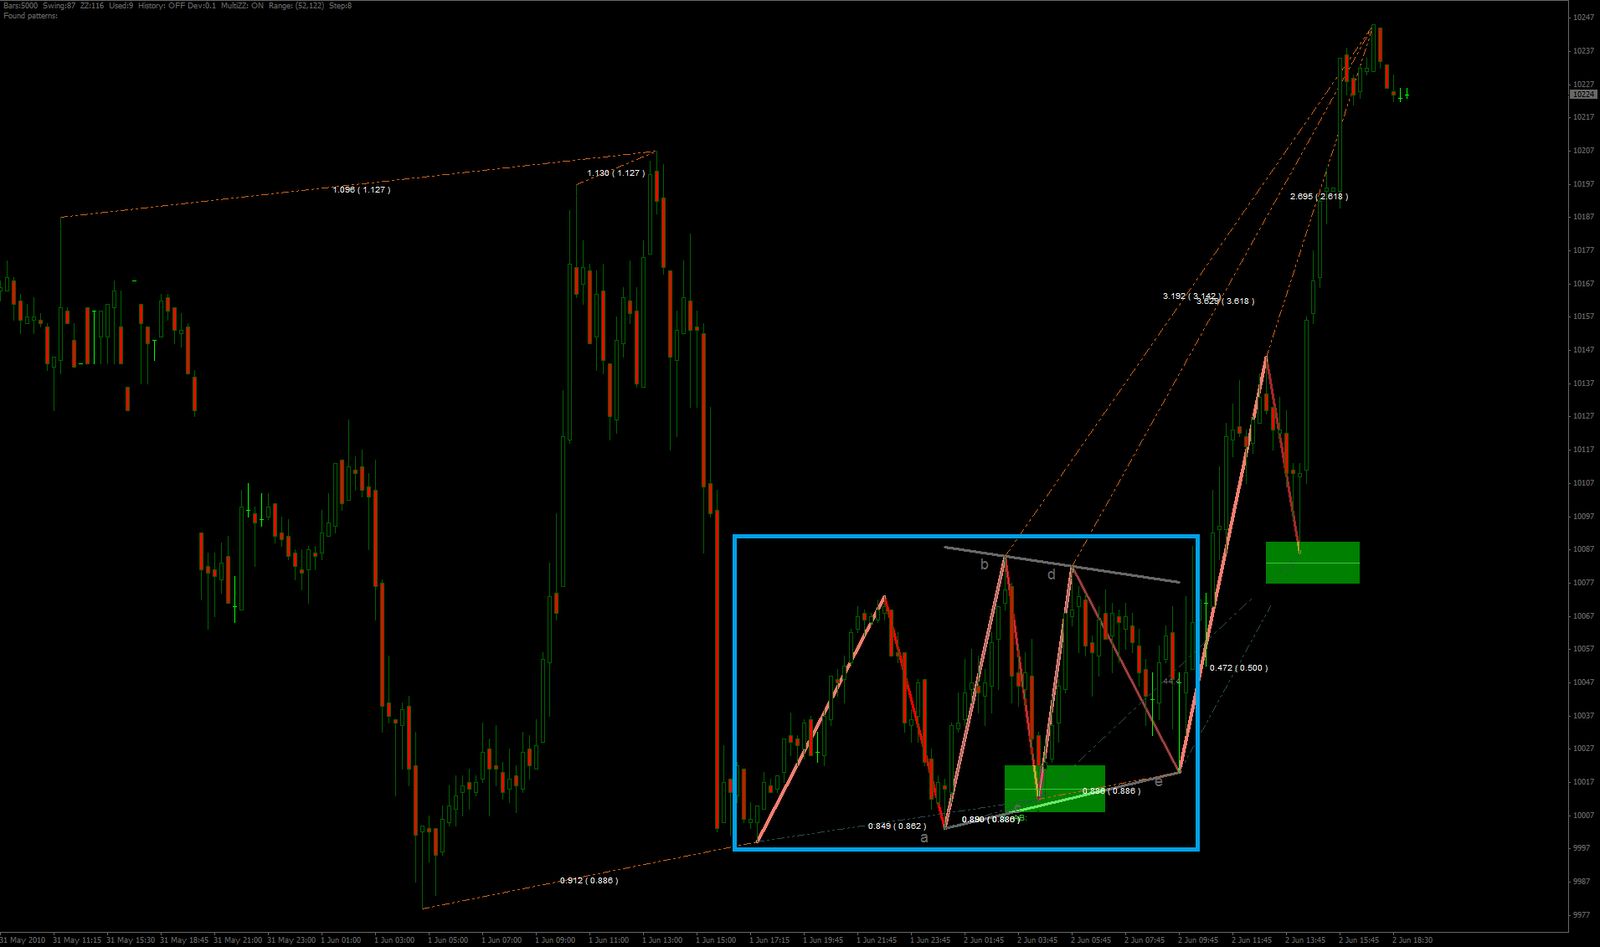
Interesting day behind. Dow Jones had bullish contracting triangle (as well as SPX and Aud-Usd had it at the same time with same timewindow) which either was B or W2 position. With this 5 minute data Dow traded pretty much all ideal EW theory wave sizes to reach 3.142 / 3.618 size from potential W1 area with closing price as one example. M cycle bullish pattern also inside of triangle was presented.
While market standard deviation is still trendemous high, it´s not actually do any kind of new lower lows or higher highs instead trading sideways, but there is something interesting with Dow Jones 10.000 points. This is also where approximately many individual stocks SMA200 lines are standing.
Most EquityBrokers and smaller private but professional investment houses have loan from one institution they are serving (most for order executions). This loan is used to buy stocks as forever holdings meaning it is in fact 100% leveraged position and these holdings they are planned to keep it as long position to the end of this world meaning no touching it but earning yields + capital gain year after an year. Between some of them this Dow Jones 10.000 is considered terminal point are we in the bull market or bear market – pretty much the same way as SMA200 line is handled by these “very passive trading hands”.
This market has been up and jumping from this level several times over the passed weeks, overlapping it a few hundred points, then rally again – same again. Local bottom on last week was generated when these very passive trading hands panicked and started to execute some of their longs as key techical perspective started to confirm bear market has come with those simple factors. That of cource worked as vica verca as market often does and it created very oversold situation in shorterm which market bought to rally as next.
Keep watching, if it is going get broken or not and if it does what´s the volume on there.