

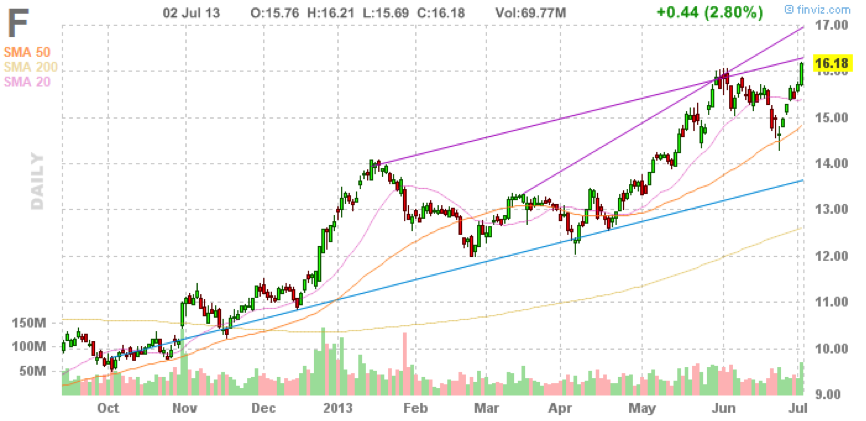
Over the past 30 days, Ford Motor Co. (NYSE: F) has traded in a $14.30-$16.21 range. Recently, on the technical front, Ford formed a bullish crossover of its upper Bollinger band, with support around $15.40 and resistance in the $16.40 range. The stock is currently trading above the 50-day moving Average ($15.55) and the 200-day moving average ($13.89).
A LOOK AT FUNDAMENTALS
Ford’s short-term bullish technical indicators are supported by strong fundamentals as well. During the most recent quarter, Ford net income rose 15 percent to $1.6 billion as record North American profits overcame weakness in Europe and South America. Excluding one-time charges, including restructuring costs in Europe, Ford would have earned 41 cents.
Ford was also able to experience top-line growth. Revenue rose 10 percent to $35.8 billion, beating Wall Street’s forecast of $33.5 billion. In North America, Ford Motor earned $2.4 billion, where sales of its F-Series trucks and Fusion sedan and Escape SUV have been strong. That offset a $462 million loss in Europe, where Ford’s sales fell 20 percent during the quarter. Ford sold 1.5 million vehicles in the first quarter, 10% more than a year ago. Ford’s unit sales in Asia Pacific climbed 30 percent to 282,000 vehicles. The region now accounts for a fifth of the company’s total vehicle sales.
For full year 2013, the company’s guidance remained unchanged. Ford expects another strong year, with total company pre-tax profit about equal to 2012, operating margin about equal to or lower than 2012, and automotive operating-related cash flow higher than 2012.
Ford’s trailing price/darnings ratio stands at 11.42, below the industry average of 13.80 and below the S&P 500 average of 16.70. F’s current price/sales of 0.48 is slightly below the average of its industry, of 0.49. The beta of 1.57 implies higher volatility of the stock with respect to the S&P 500. F pays $0.40 or 2.38 percent dividend.
OPTIONS PLAY
Technical and fundamental indicators both show a short-term bullish signals for F.
Investors should consider the following debit call spread: Buy August 2013 $17 Calls and sell the August 2013 $18 Calls for a net debit of $0.30. We recommend holding until spread price reaches $0.70. The loss is limited to the option premium that you paid ($0.30).
The debit spread will allow investors to collect time premium for the out of the money short call, while it also decreases the cost of the long call, making it a favorable risk/reward ratio
[Editor’s note: Do you have any option-related questions at all? If so, post a comment below and Tradespoon option expert: Vlad Karpel can help.]
= = =
See Tradespoon’s free trial offer here.
= = =

