

You likely know that I track TSLA pretty frequently. This is probably my 13th article on TSLA for TraderPlanet over the last 4 years, maybe even more. Regardless, below are some facts and some of my opinions regarding the technical prowess of this electric stock.
Facts.
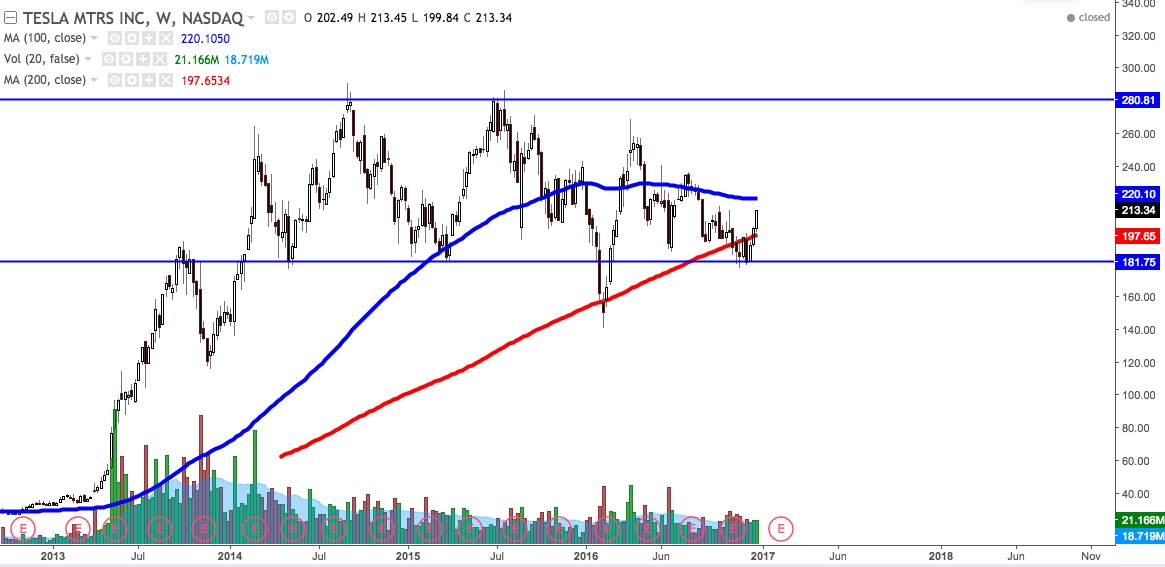
- The 200 simple moving average on a weekly is $197.65 – TSLA’s stock price is currently above that price.
- TSLA broke the 200 SMA on a weekly briefly before (back in February 2016) before it had a massive bullish move. (This time could be similar [is my opinion.])
- The 100 SMA on a weekly chart is $220.10 (which TSLA’s stock price is below.
- The 200 SMA on a daily chart is $214.56, which TSLA is below.
- The 100 SMA on a daily chart is $202.62, which TSLA is above.
- TSLA is above the 10,20 and 50 exponential moving averages on both the weekly and daily charts.
My opinions:
- It really seems TSLA has bounced nicely off the $181.75 before in the past a few times.
- It likely appears TSLA is doing just that, once again.
- On the daily chart TSLA looks like it has formed a strong double bottom chart pattern, with the neck line being at approximately $197
- In my viewpoint, I would say TSLA is in a large channel between $181.75 and $280.
- There likely will be some slight slowdown on TSLA as that $215 – $220 ranges from the longer term averages and possibly the longer retest of that double bottom neckline, but traveling into 2017, my outlook for the first 2 quarters will be bullish to neutral on TSLA.
My weekly chart is below.
I didn’t JUST go bullish on TSLA by the way. Check out my video from 2 weeks ago (yes, you read that right) when I was mentioning about getting into weekly calls on TSLA. Safe to say, they worked well.
Thanks for reading!! You rock!!
Jerremy Alexander Newsome is a full-time trader and the CEO and co-founder of Real Life Trading – a community of innovative, inspiring, and driven people from all around the world.

