The S&P 500 e-mini contract (ES) dropped in overnight trading but managed to recover and close at 2080.00, three ticks above Monday’s close. The short-term uptrend support line holds the price up even though overnight trading had a small shakeout move and broke the support line once.
However the futures made a lower high and a lower low, and formed a doji on the daily chart. That may be the signal for a little bounce in the next day or so.
Today
Today the bounce could continue as long as 2075-73.50 holds up. If the momentum is strong in the morning, ES may also attempt to fill the unfilled gap at 2092.25. The price could also bounce up to test the 10-day moving average line around 2095. But as long as ES stays under the 2098 level, there is a good chance for a pull back down again on Friday.
The 135-day moving average line area (2066-2062.50 zone) is one current support area. How well it holds up later will depend on how high ES bounces now. If the bounce is weak, ES could break this support area later and head toward the yearly pivot line at 2055.
The major support levels for Wednesday: 2072.50-68.50, 2062-59.50;
major resistance levels: 2106-07, 2123.50-2121.75, 2134-36.60
To get more actionable analysis of US equity markets from Naturus, follow this link
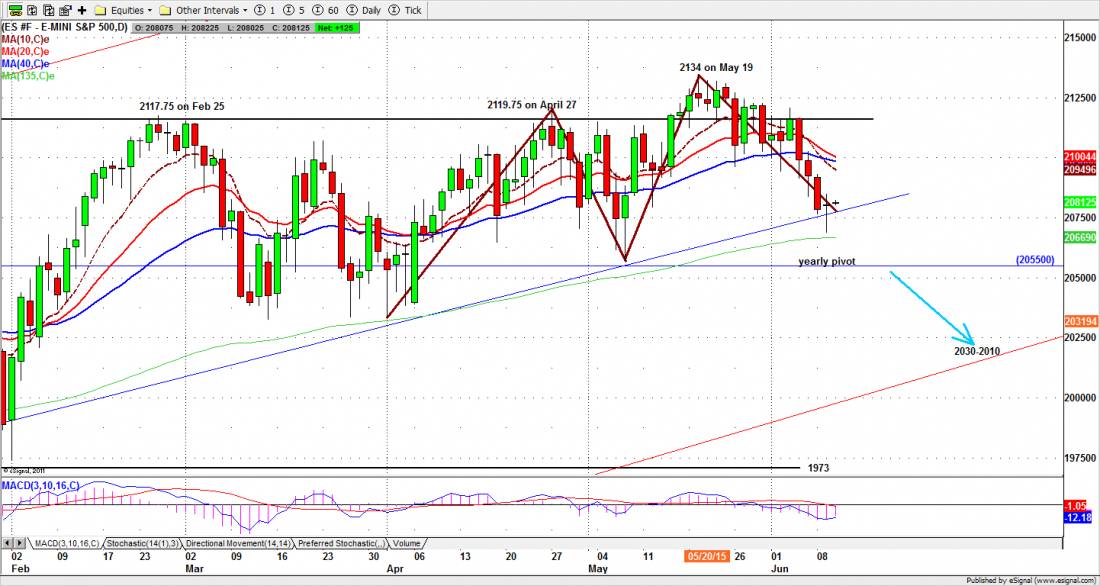
Chart: ESM5 Daily chart, June 9, 2015