
 As a congratulatory hat tip to David Varadi on the launch of his new DV Indicators website, this post investigates potential trading edges gained by combining observations of the absolute value of David’s bounded DV indicator together with its smoothed difference relative to Welles Wilder’s classic Relative Strength Index (RSI).
Both indicators construct oscillators that compare current price to historic levels. However, while the RSI strictly employs differences in recent closes, the bounded DV looks at a great array of relationships between daily closes and their high/low ranges, prospectively capturing inherent volatility effects in addition to relative price placement.
An initial investigation suggests that differences in their respective behaviors and resulting lead-lag effects may be exploited to derive high-edge short-term swing systems and investment hedging strategies alike, as summarized below.
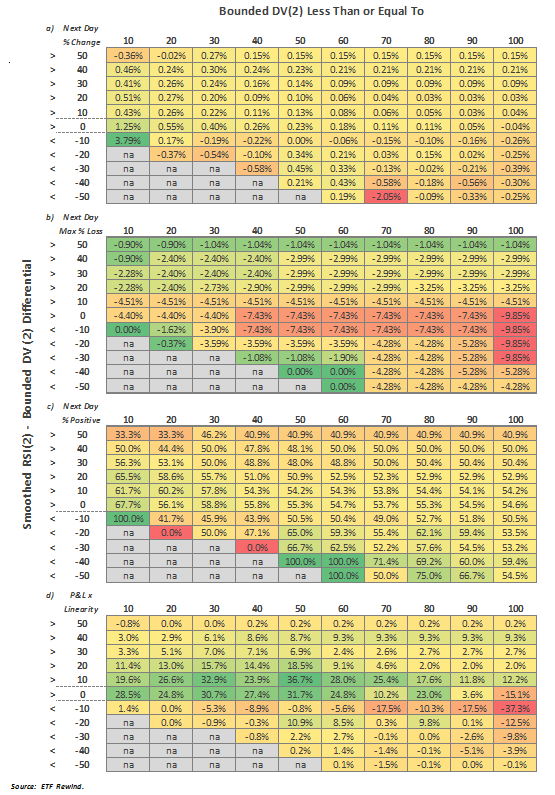
Performance Above & Below Various Differential Thresholds
CSS Analytic’s research indicates that the more positive the divergence between RSI(2) and DV(2) as measured using a proprietary smoothed RSI-DV calculation, the greater the next-day return expectation and vice-versa.
Additionally note below how these edges may change according to the absolute value of DV(2), with the far right-hand side of each table including all values of DV(2), then becoming progressively oversold towards each left-hand side. Maximum next-day loss expectations also increase as divergences become more negative. Various short-term trading strategies may be tested based on these observations.
Differential ><
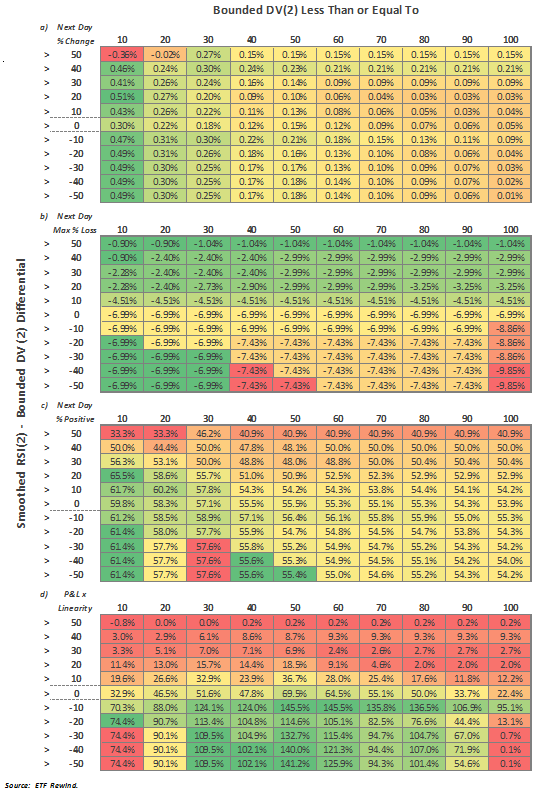
Performance Above Various Differential Thresholds
Here we see aggregate performance above various thresholds only. Focusing on Cumulative Profit and Loss multiplied by Equity Curve Linearity (see table d), note how Differential readings greater than -10 in combination with absolute DV(2) readings below 60 maximize returns for minimized risk.
This suggests a long-term strategy whereby investors may consider hedging their holdings when these criteria are not satisfied.
Differential Greater Than Only
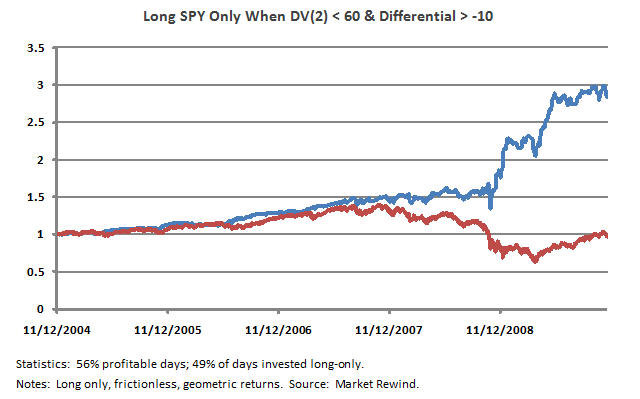
A Systematic Hedging Strategy
The following chart shows the results of our hypothetical hedging strategy using the SPY as a proxy, going to cash each time our Divergence/ DV(2) filters are not favorable. The strategy was only invested 49% of the time during the 1,250-day study period. Positive results were also found for many other major equity-based ETFs.
Again, congratulations to the CSS Analytics crew on the launch of their new website: It’s a DV World Baby! We all look forward to seeing it evolve and grow.
Never Investment Advice. This article was first published for ETF Rewind subscribers several weeks ago. The ETFR scans nearly 200 ETFs each night for setups that fail the discussed thresholds. For additional reading on DV vs. RSI differentials, I also want to recognize this terrific predecessor/companion article by Woodshedder. As a disclosure, I assisted in programming many of the available indicators according to DV’s specifications.

