
How To Take Advantage Of High Frequency Trader Price Action

Recognizing the High Frequency Trader HFT footprint on a stock chart, presents ways for individual traders to use the candlestick patterns created to their advantage. HFT orders are algorithms which are computer programs that are automated, and occur at speeds on the millisecond scale. Therefore traders will find their orders have been front run by the HFTs, if they try to enter after an HFT order triggers.
The HFT footprint is unique on a stock chart, and there is no other technical candlestick pattern like it. When you know what to look for, the patterns stand out immediately. An excellent example of a stock chart that had HFTs trading aggressively twice is Intel Corp (NASDAQ:INTC) shown below in Fig 1. On June 13th and July 16th HFT orders were so numerous before market open, that it caused the stock to gap up. A gap is a space between the candlesticks where there are no candles. Gaps form in stock charts when the pre-market order flow is huge, or when overseas markets have moved up the stock price ahead of the US open. When these occur market makers must move price up before our markets open, consequently causing the gap.
The HFT footprint is the gap in Price, the extraordinarily long green Volume indicator bar in the middle chart window, and the sudden change of color and size on the Balance of Power BOP indicator which is the uptick/downtick large lot indicator shown in the bottom chart window.
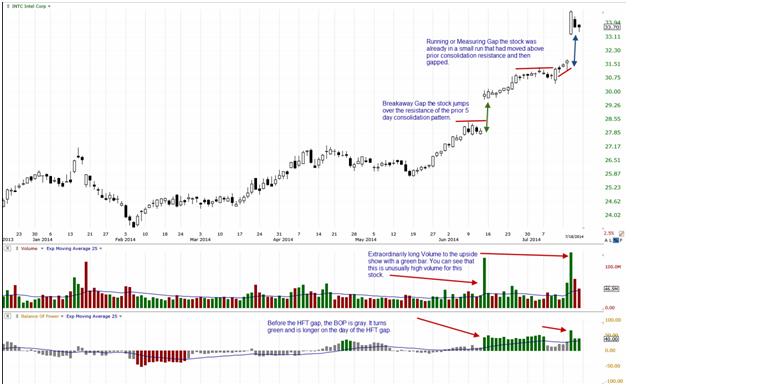
Each time the HFTs took control of price, the stock gapped about 2 points. The first gap on June 13th is a true Breakaway Gap, which jumps over resistance and does not fill. This means that the open space between the prior price and the current price will remain open. Breakaway Gaps rarely fill as they are an important Shift of Sentiment™ in a candlestick pattern. The second HFT gap on July 16th is a Running aka Measuring Gap, and sometimes these do fill somewhat.
The second part of the analysis is to study what type of price patterns preceded the gaps. In each instance, Volume was at or slightly above the Moving Average line, and Balance Of Power was gray and above its Moving Average line. Price was also in a consolidation mode with horizontal candlesticks, indicative of Dark Pool large lot quiet accumulation.
HFTs prefer to chase Dark Pool large lot quiet accumulation. HFT algorithms are also designed to react to news. In this instance Intel Corp on June 12th after market close, announced they were raising the second quarter as well as the full year Revenue and Gross Margin expectations. On July 15th after market close, they reported an outstanding Earnings Report. Each of these news announcements triggered the HFT orders.
In both instances the market had already closed for the day prior to the gap. So as an individual fundamentalist investor or trader there was no way to buy INTC based on the news until the next day, when of course the stock gapped at open. However individual investors and traders had several days prior to the gaps when quiet accumulation patterns could be seen using technical indicators, which revealed that Dark Pools were indeed buying the stock ahead of the news releases. In this way, individual investors and traders have a decided advantage over both fundamentalists and HFTs.
Buying into a stock after it has gapped up is a much higher risk entry, because many professional traders are taking profits on short term trades entered before the gap occurred. Also the Angle of Ascent™ of the trend on the long term is now too steep to sustain, so more profit taking and a probable correction increases the risk for any entry then. In addition when studying the monthly line chart, INTC is at a strong resistance level from the 2003 yearly high. Although this high was some time ago, even fundamentalists will be aware that this is resistance as well.
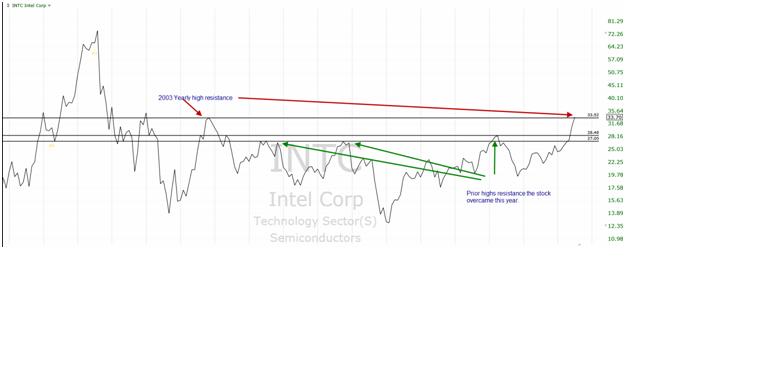
This doesn’t mean that opportunities for this stock are over. The stock’s all time high is around 74.00 in the year 2000. If the company’s reinvention continues to improve Revenues and Earnings, the company’s stock could see more Dark Pool large lot Institutional interest. Currently there are 1,721 Institutional Holders with 65.14% of the Outstanding Shares, which is lower than average for blue chip companies so the firm has potential for more Institutional investors.
Summary
Use candlestick stock charts and technical analysis to see opportunities to front run High Frequency Traders. Reading the charts to see where the Dark Pools are investing has become more important than ever, for both technical and fundamental individual investors and traders.
Thank You For Reading My Article
Trade wisely,
Martha Stokes CMT
TechniTrader technical analysis using TC2000 charts, courtesy of Worden Bros.
Disclaimer: All statements, whether expressed verbally or in writing are the opinions of TechniTrader its instructors and or employees, and are not to be construed as anything more than an opinion. Readers are responsible for making their own choices and decisions regarding all purchases or sales of stocks or issues. TechniTrader is not a broker or an investment advisor; it is strictly an educational service.
