Swing Traders Guide To A Successful Trade

So why swing trading?
Swing trading is the sweet spot between day and position trading. It is a strategy that combines both technical and fundamental techniques. It is the optimum trading strategy for part time traders. It uses time frames that are too long for day traders and too short for investors. The working space for swing traders is the 60 min chart and the daily chart in general.
How do you find trades or how do you find high probability trades?
Because this is what it is all about. Finding trades that follow through and accelerate to targets rather than slowly grind, never meet targets and sometime reverse and ultimately stop out. You want trades where institutional buyers are on your side at certain price points and help push your stock or ETF in the desired direction.
Finding a stock or ETF that set’s up is not everything, you need to analyze the specific sector from which you have selected your stocks and start analyzing it’s performance within the sector and in comparison to the market in general (meaning QQQ, SPY, DIA). At all times you need to be in sync with the market.
For example if you are taking a trade long in a bearish market, the stock might have a hard time reaching swing trading targets. Sometimes it can be totally on its own, depending on other fundamental factors but most of the time it needs to be in perfect correlation with the market indices. The market will be the wind behind your back.
The market is a complex system and the more you understand the mechanics the more simple you will see it is.
Here is an example of a stock selection criteria:
1. Market is in correction mode and has retraced to the fist level of support:
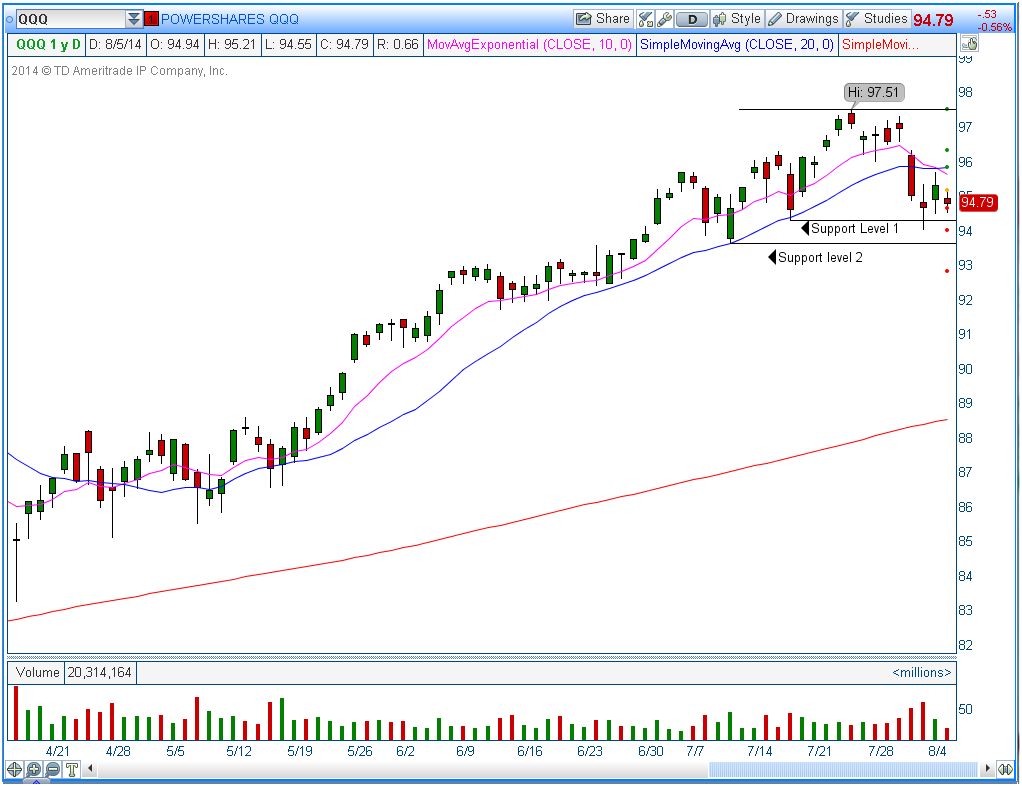
See chart of QQQ’s below

If the first level of support will hold and price will consolidate in that area and try to break above $96.00 price resistance level then there are odds that the QQQ’s will attempt to continue it’s up trending trajectory to the yearly high at $97.51. But if price breaks support we look for bearish and a test of Support level 2 is highly possible.
2. Now I will focus my attention on my game plan knowing the two possible reactions that the QQQ’s might have. If the market will break higher I will look for a sector that had been strong on the last quarter and last month. After evaluating sectors I see that Tech sector was pretty strong in the last quarter coming in second on quarterly performance after conglomerates and same on monthly basis.
Zooming in on the sectors stocks I notice some stocks are still holding strong despite the QQQ’s pullback. I create my watch list and select a few stocks. I narrow down to one or two.
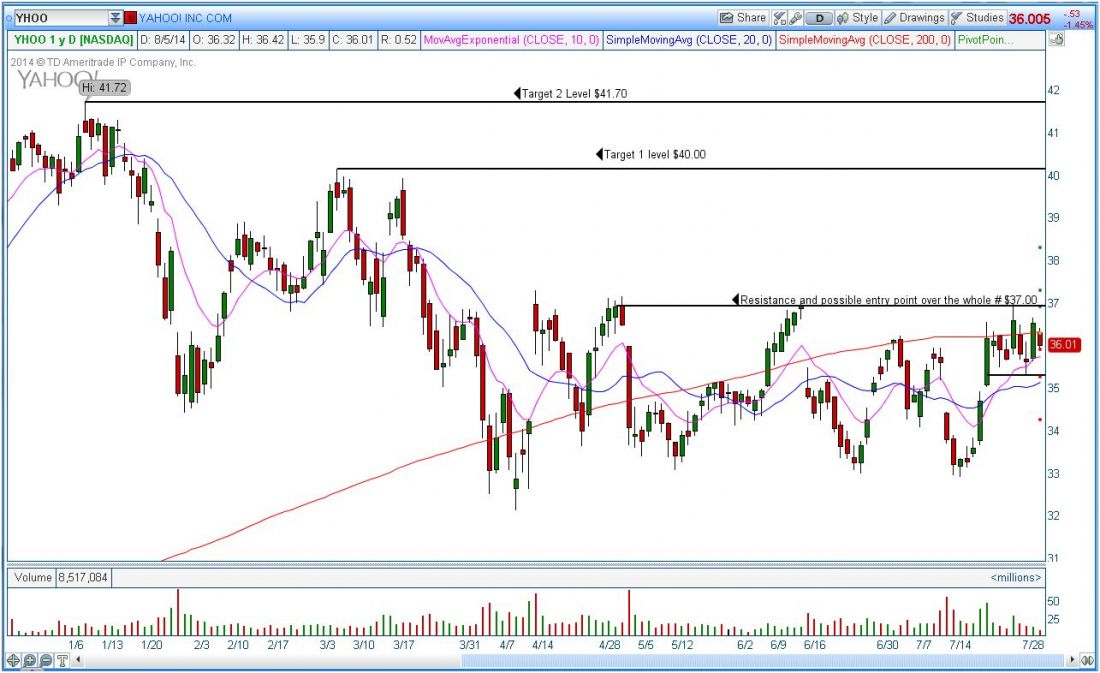
3. Now that I have selected a stocks that has relative strength compared to the market I will decide any entry point, stop area and will project targets.
Example: YHOO pre entry homework on chart. Locating an entry point, stop area, targets and risk to reward levels to assure me that the trade would be worth taking.

Now that all the work is complete all you need to do is watch.
The biggest trading secret and finding high probability trades is being in sync with the market conditions at all times.
= = =
Learn more about Metcalf’s trading education firm: Trade Out Loud.
Related Reading
Read another story by Metcalf here.
Are You Cheating On Your Entry?
Do you routinely evaluate your trades and trading performance? The Trader’s Performance Assessment (TPA) offers a constructive way to review your trading performance by Gary Dayton, Psy.D.


